| Issue |
A&A
Volume 694, February 2025
|
|
|---|---|---|
| Article Number | A214 | |
| Number of page(s) | 15 | |
| Section | Astrophysical processes | |
| DOI | https://doi.org/10.1051/0004-6361/202452024 | |
| Published online | 18 February 2025 | |
Time-integrated polarizations in the prompt phase of gamma-ray bursts via the multi-window interpretation
1
Center for Theoretical Physics and College of Physics, Jilin University, Changchun 130012, China
2
Department of Physics, School of Physics and Materials Science, Nanchang University Nanchang 330031, China
3
Purple Mountain Observatory, Chinese Academy of Sciences, Nanjing 210023, China
4
Department of Astronomy, School of Physical Sciences, University of Science and Technology of China Hefei 230026, China
⋆ Corresponding authors; This email address is being protected from spambots. You need JavaScript enabled to view it.
; This email address is being protected from spambots. You need JavaScript enabled to view it.
Received:
28
August
2024
Accepted:
12
January
2025
Abstract
Aims. We used multi-window observations, including the light curve and evolutions of the spectral peak energy (Ep), the polarization degree (PD), and the polarization angle (PA), to infer the model parameters for predicting the time-integrated PD in the prompt phase of gamma-ray bursts (GRBs).
Methods. We selected 23 GRBs that were codetected by Fermi/GBM and polarization detectors (i.e., GAP, POLAR, and AstroSat). In our multi-window fitting, the light curve, Ep curve, PD curve, and PA curve were interpreted simultaneously under the synchrotron radiation model in ordered magnetic fields (i.e., the aligned-field case and the toroidal-field case).
Results. For bursts with strong (∼90°) PA rotations, the predicted time-integrated PD of the aligned-field case roughly matches the corresponding observed best-fit value, while it is higher for the toroidal-field case. For bursts without strong (∼90°) PA rotation(s), the predicted PDs of the aligned-field case and the toroidal-field case are comparable and can interpret the observational data equally well. The observed time-resolved and time-integrated PDs for GRB 170206A are comparable and are both lower than our predicted upper limits in ordered magnetic fields. This means that mixed magnetic fields, that is, magnetic fields with both ordered and random components, probably reside in the radiation regions of this burst. Except for one out of the total 23 bursts, the predicted time-integrated PDs, which are ∼44% for the aligned-field case and around 49% for the toroidal-field case, are consistent with the corresponding observed values. Consistent with previous study, the models with synchrotron radiation in ordered magnetic fields can therefore interpret most of the current polarization data within an error bar of 1σ.
Key words: magnetic reconnection / polarization / radiation mechanisms: non-thermal / methods: statistical / gamma-ray burst: general
© The Authors 2025
 Open Access article, published by EDP Sciences, under the terms of the Creative Commons Attribution License (https://creativecommons.org/licenses/by/4.0), which permits unrestricted use, distribution, and reproduction in any medium, provided the original work is properly cited.
This article is published in open access under the Subscribe to Open model. This email address is being protected from spambots. You need JavaScript enabled to view it. to support open access publication.
1. Introduction
Even decades after the detection of the first gamma-ray burst (GRB), the origin of these bursts is still debated. They are the most catastrophic events in the Universe. The light curves of GRBs are highly diverse, which adds to the difficulty of finding their physical origin. However, the spectrum of GRBs is often described by the Band function (Band et al. 1993), which is a broken power law that is smoothly jointed at (αB − βB)Ep/(2 + αB), where Ep is the peak energy of the νFν spectrum and αB (βB) is the low-energy (high-energy) spectral index of the photon number flux. Observationally, there are mainly two types of the peak-energy evolution patterns: the hard-to-soft and the intensity-tracking patterns (Liang & Kargatis 1996; Ford et al. 1995; Kaneko et al. 2006; Lu et al. 2010, 2012, 2018). The origin of the Band function is also elusive.
Three popular models have been invoked to interpret observations of the GRB prompt phase (Narayan et al. 1992; Paczynski & Xu 1994; Rees & Meszaros 1994; Thompson 1994; Eichler & Levinson 2000; Mészáros & Rees 2000; Giannios 2008; Zhang & Yan 2011). In the scenario of the internal shock and the magnetic reconnection models, the radiation mechanisms are the synchrotron emission (Daigne et al. 2009; Lan et al. 2021a; Giannios 2008; Zhang & Yan 2011). However, in the photosphere model, the mechanism is the multiple inverse-Compton scattering in high-energy gamma-rays (Thompson 1994; Lundman et al. 2018; Parsotan et al. 2020). Since all three models can explain the observed light curves and energy spectra in the GRB prompt phase, these models and hence their corresponding radiation mechanism cannot be distinguished by traditional observations. As a new window, polarization is very sensitive to the radiation mechanism, to the magnetic field configuration (MFC) in the radiation region, and to the geometry (Waxman 2003; Granot 2003; Rossi et al. 2004; Lazzati 2006; Toma et al. 2009; Lan et al. 2021b; Gill et al. 2021; Guan & Lan 2023; Sui & Lan 2024). Therefore, it can be used as a powerful tool for inferring these properties of the radiating sources.
Because the depolarization is due to the multiple scatterings, the predicted polarization degree (PD) is roughly zero in the gamma-ray band for the photosphere model (Lundman et al. 2018; Parsotan et al. 2020; Parsotan & Lazzati 2022). However, the predicted time-integrated PD can be as high as (40 − 50)% for the synchrotron model in an ordered magnetic field (Toma et al. 2009; Gill et al. 2020, 2021; Guan & Lan 2023; Sui & Lan 2024). When the polarization angle (PA) rotates with time (or energy) and/or when the magnetic field is mixed1 in the radiation region, the time- and/or energy-integrated PD is reduced. The predicted time-integrated PD can range from 0% to 50% for the synchrotron models (Lan et al. 2019; Sui & Lan 2024). Therefore, precise PD observations are important for distinguishing the models and hence the corresponding radiation mechanisms during the GRB prompt phase. When the gamma-ray emission in the GRB prompt phase is unpolarized, the photosphere model succeeds in interpreting it, and the synchrotron model with an entirely random magnetic field can interpret these observations as well. However, when the PD of the gamma-ray radiation is nonzero, the photosphere model is rejected.
The Gamma-Ray Burst Polarimeter (GAP) is a polarization detector that measures the linear polarizations in the GRB prompt phase in the energy range of 70 keV to 300 keV (Yonetoku et al. 2006; Murakami et al. 2010; Yonetoku et al. 2011a). POLAR is also a dedicated GRB polarimeter, and the linear polarizations were measured in the energy range of 50 keV to 500 keV (Produit et al. 2018). The Cadmium Zinc Telluride Imager on board AstroSat is an operational GRB polarization detector, and it measures the polarization in the energy range of 100 keV to 600 keV (Chattopadhyay et al. 2022). There should be sufficient photons for a polarization analysis. Most of the current polarization observations are the time- and energy-integrated results (Yonetoku et al. 2011b, 2012; Zhang et al. 2019; Kole et al. 2020; Chattopadhyay et al. 2022). Time-resolved observations are relatively rare, and a time-resolved polarization analysis has only been reported for four GRBs (Yonetoku et al. 2011b; Zhang et al. 2019; Burgess et al. 2019; Kole et al. 2020; Sharma et al. 2019; Chattopadhyay et al. 2022).
Three bursts were detected by the polarization detector GAP and were reported. The averaged best-fit value of the time-integrated PD of these 3 bursts is relatively high (∼60%) (Yonetoku et al. 2011b, 2012). However, for another 4 GRBs detected by GAP, only the upper limits were presented (Gill et al. 2021). Therefore, the statistically averaged PD value of the GAP bursts are so far undetermined. The observed time-integrated PDs of 15 of the 20 bursts detected by AstroSat are upper limits at the 2σ level. The other 5 bursts were reported with high PD best-fit values with 1σ error bars (Chattopadhyay et al. 2022). Therefore, the statistically averaged value of the PD of the AstroSat bursts is also unclear. There are 14 GRBs with reported polarization detections by the POLAR (Zhang et al. 2019; Kole et al. 2020), and the averaged best-fit value of the time-integrated PD is 17.79%. The smallest lower limit of the detected time-integrated PD within the 1σ confidence level is 16% for the GAP bursts, and the highest upper limit of the detected PD within 1σ is 84% for the POLAR bursts. Since the observational errors are rather large and the confidence levels (usually within 1σ) are relatively low, the current data agree in general.
Time-integrated PDs in the GRB prompt phase were recently studied by Guan & Lan (2023). They used the observed parameters of the energy spectra to estimate the time-integrated PD, for which the time-resolved information was lacking. However, time-resolved polarization observations are currently available for four GRBs. In three of these four GRBs, the PA rotated at least once during the burst, which reduces the time-integrated PD. The variations in the parameters on the equal arrival-time surface (EATS) also impact the final time-integrated PDs (Sui & Lan 2024). Therefore, the time-evolution effect should not be neglected when the time-integrated PDs are deduced. The parameters were taken at their typical or fiducial values and varied in reasonable ranges when the time-integrated PDs were predicted in Sui & Lan (2024). In addition to the polarization observations, the observed light curves and energy spectra also place limits on the model parameters. Therefore, in order to predict more precise time-integrated PDs in the GRB prompt phase, multi-window interpretations (i.e., the simultaneous fitting and interpretation of the light curve, Ep curve, PD curve, and the PA curve) are needed.
We study the time-integrated PDs in the GRB prompt phase via a time-resolved multi-window fitting. The EATS effect is considered, and the time-resolved information is included. The observed PA rotations are recovered during the bursts. More importantly, we infer most of the key model parameters from the fitting of the light curves, the energy spectra, and the polarization curves. The predicted time-integrated PD for each burst is customized. In Sect. 2 we present the data processing. In Sect. 3, we describe our model. In Sect. 4 we present our numerical results. Finally, we conclude and discuss our results in Sect. 5.
2. Data reduction
The light curves and Ep curves were obtained from Fermi/GBM data through the following procedure. The code RMFit v4.3.2 was employed for the data analysis (Gamma-ray astronomy Group 2014). The observational database was downloaded from the official website of the Fermi Gamma-ray Burst Monitor (GBM)2. For each GRB, we selected two sodium iodide (NaI) detectors that were closest to the GRB center and one bismuth germanate (BGO) detector. We used GBM time-tagged events (TTE) with a precision of 2 μs precision in the data reduction. We selected a photon energy from 8 keV to 1000 keV for the NaI detector and from 200 keV to 40 MeV for the BGO detector. We selected two intervals as the background intervals and employed a polynomial model with 0-3 order to fit the background. After this, we performed the time-averaged and time-resolved spectral fitting using a χ2 statistics. For the time-averaged spectrum, we selected the GBM T90 interval in the 50–300 keV energy band as the analyzed duration (von Kienlin et al. 2020). For the time-resolved spectral analyses, we derived the time bins by setting the signal-to-noise ratio (S/N) to between 12 and 100 for GBM T90. A typical Band function was employed to fit all spectra (Band et al. 1993). We calculated the spectral parameters (e.g., Ep) and photon flux (between 8 keV and 40 MeV) of the individual spectrum from the best-fit result.
The data of the polarizations were taken from the published papers (Yonetoku et al. 2011b, 2012; Zhang et al. 2019; Kole et al. 2020; Chattopadhyay et al. 2022). The energy ranges for the polarization data were 70 keV to 300 keV, 50 keV to 500 keV, and 100 keV to 600 keV for the bursts detected by GAP, POLAR, and AstroSat, respectively (Yonetoku et al. 2011b, 2012; Zhang et al. 2019; Kole et al. 2020; Chattopadhyay et al. 2022). Our sample contained 23 bursts that were codetected by the Fermi/GBM and polarization detectors. The main information for these bursts is shown in Table 1. The confidence level for the errors of the observed time-integrated PD (PDobs) is 1σ, and it is 2σ for the upper limits of the PDobs. The confidence level for the time-integrated photon spectral indices (αB and βB) is also 1σ. In our sample, the average value of the observed time-integrated PD is about 60% for the GAP bursts, about 50% for the AstroSat bursts, and about 22% for the POLAR bursts. The minimum lower limit of the observed time-integrated PD within 1σ is 16% for the GAP bursts and 28.32% for the AstroSat bursts. The maximum upper limit of the observed time-integrated PD within 1σ is 84% for POLAR bursts. Because of the large observational errors, the detection results of the three detectors agree in general. In addition, the errors of the current data are roughly within the confidence level of 1σ. These results may coincide with each other at a higher confidence level.
Spectral parameters and polarization properties of the 23 GRBs.
The bursts we analyzed were codetected by Fermi/GBM and the polarization detectors (GAP, POLAR, and AstroSat). By fitting the light curve and Ep curve (which were obtained from the Fermi/GBM data), we obtained the values of most model parameters, and we then calculated the polarization based on these inferred parameters. The GRBs that did not trigger Fermi/ GBM were detected by the corresponding polarization detectors. Because the energy band of the corresponding polarization detector is relatively narrow for energy spectrum analysis, we did not analyze these bursts.
3. The model
The model we used to fit the time-resolved multi-window observations is same as used by Wang et al. (2024). We assumed that a GRB at redshift z originates from the synchrotron radiation of the multiple thin emitting shells. These shells, with different physical properties, were injected discontinuously because of the activities of the GRB central engine. They were assumed to expand radially at relativistic velocities. The process of the magnetic reconnection in each individual shell is thought to deplete the magnetic energy and provides the energy for the acceleration and radiation of the shell. The relativistic electrons were assumed to be injected isotropically into each shell with a rate of Rinj, and they radiate the synchrotron photons in the magnetic fields. We assumed single-energy electrons (Uhm et al. 2018). For the i model (corresponding to the observed hard-to-soft Ep evolution pattern), the variation in the electron Lorentz factor with radius was assumed to be  , where
  is the value of the electron Lorentz factor at r0. For the m model (the corresponding Ep evolution pattern is intensity tracking), we took
  for r ≤ rm and
  for r > rm, where
  is the value of the electron Lorentz factor at the normalization radius rm. Unless specified otherwise, we took g = −0.2 for the i model and g = 1.0 for the m model, respectively (Uhm et al. 2018).
All the shells are expected to begin to radiate at radius ron at the burst source time ton and stop at radius roff. The dynamics of the shells depend on the central engine (Drenkhahn 2002). For a perpendicular rotator3, the magnetic field in its ejecta is aligned, and the reconnection of this field leads to the bulk acceleration of the jet shell. For a black hole central engine, the magnetic field in the jet is toroidal, and the reconnection of the toroidal field leads to a roughly constant-velocity jet shell at large radii. The bulk Lorentz factor of each shell then reads Γ(r) = Γ0(r/r0)s, where Γ0 is the bulk Lorentz factor of the shell at the normalization radius r0, and s = 1/3 (0) for the aligned-fields (the toroidal-fields) case (Drenkhahn 2002). Meanwhile, the magnetic field in the shell decays with radius B′(r) = B′0(r/r0)−b, where B′0 = 30 G is the strength of the magnetic field at r0, and the decay index b was taken as 1.0. For simplicity, the MFC in each jet shell was assumed to be large-scale ordered. Except for the MFC, the other physical properties were assumed to be independent for the emitting shells of one burst.
The time-resolved and energy-averaged flux density of the emission from a burst is
 (1)
(1)
where hν1 = 8 keV, hν2 = 40 MeV. Here, ν is the frequency, and Fν is the time- and energy-resolved flux density of the single burst. The corresponding expression can be found in Wang et al. (2024).
The predicted time-resolved and energy-integrated PD and PA (preliminary) of a burst with aligned fields in all the radiation shells (aligned-field case) read
 (2)
(2)
 (3)
(3)
where F = ∫ν1ν2Fνdν, Q = ∫ν1ν2Qνdν, and U = ∫ν1ν2Uνdν are the time-resolved and energy-integrated Stokes parameters. Here, hν1 and hν2 are the lower and upper limits of the corresponding polarization detectors. Qν and Uν are the time- and energy-resolved Stokes parameters Q and U of a single burst, respectively. Their expressions can be found in Wang et al. (2024). When Q > 0, the final PA (PA) of a burst is PA = PApre. When Q < 0, the final PA is PA = PApre + π/2 when U > 0, and it is PA = PApre − π/2 when U < 0 (Lan et al. 2018).
For a burst with toroidal fields in all its emitting shells (toroidal-field case), the Stokes parameter Uν equals zero because of the axial symmetry of the emission region and the reference axis selected here. The time-resolved and energy-integrated PD is defined as follows:
 (4)
(4)
When the PD changes sign, the corresponding PA abruptly changes by 90°.
Finally, the time-integrated and energy-integrated PD of a burst for the aligned-field case reads
 (5)
(5)
where  ,
,  , and
, and  are the time-averaged and energy-integrated Stokes parameters. The accumulated flux reaches 5% (95%) of the total flux of the burst at the time of T5 (T95), and T90 = T95 − T5. For the toroidal-field case, the time-integrated and energy-integrated PD is
 (6)
(6)
4. The numerical results
4.1. The time-resolved multi-window fitting results for the total 23 GRBs
The concrete fitting procedure of the time-resolved multi-window observations for a single GRB was described by Wang et al. (2024). The half-opening angles of the jets for all 23 bursts were set to be the typical value of θj = 0.1 rad (Rouco Escorial et al. 2023; Lloyd-Ronning et al. 2019). Unless specified otherwise, the shells began to radiate at ron = 1014 cm and stopped at roff = 3 × 1016 cm. Since GRBs with polarization detections are usually very bright, this indicates on-axis observations. Because the predicted time- and energy-integrated PD is roughly independent of the observational angles for on-axis observations of the aligned-field case (Sui & Lan 2024; Lan et al. 2021b), we simply took the observational angle θV = 0 rad for the aligned-field case. The normalization value of the bulk Lorentz factor for the aligned-field case was taken as Γ0 = 250. For the toroidal-field case, we took θV = 0.06 rad and the normalization radius r0 = 1015 cm. With the adopted parameters, the main radiation region (1/Γ cone) is far smaller than the jet region, and the MFC within the radiation cone is roughly aligned for the toroidal-field case. The predicted time- and energy-integrated PD is therefore roughly the same as the theoretical upper limits for the toroidal-field case (Sui & Lan 2024; Lan et al. 2021b; Toma et al. 2009). The low- and high-energy photon spectral indices αB and βB of each burst were set to their observed time-integrated values, which are listed in Table 1. For the bursts without a redshift observation, we set z = 1. The other parameters used in fitting can be found in ParameterSet. For each burst, the parameter set with the parameter δ (the orientation of the field) was used for the aligned-field case, and the other set was used for the toroidal-field case. Compared with the observed Ep curve, the decay stage of the calculated stage of GRB 170305A is very shallow, with an index g = −0.2 for the i model. We therefore took g = −1.0 for the aligned-field case and g = −1.5 for the toroidal-field case to match the observational data.
Li et al. (2024a) discussed the effect on the value of Γ0 and θj of the predicted polarizations. The time-resolved PD depends on the variation patterns of the bulk Lorentz factor Γ with radius (see Fig. 1). With the increase in Γ0, the time-integrated PD at 300 keV decreases monotonically (see Fig. 4). The decay rate of the time-integrated PD with Γ0 depends on the model, for example, the maximum time-integrated PD is about 65% when Γ0 = 50, and it decays to 45% when Γ0 = 800 for the [2bi] model (with an aligned magnetic field in the radiation region). The impact of θj on the time-resolved polarizations was not discussed in Li et al. (2024a). The time-integrated PD decreases quickly with θj when θj < 0.03 rad, and it is then roughly a constant (∼53%) with θj when θj > 0.03 rad for the [2bi] model (the magnetic field is aligned in the radiation region). The influence of Γ0 and θj on the PA rotation was described by Li et al. (2024b), Cheng et al. (2024). With an increase in θj or Γ, the predicted PD decreases because the contribution of the emission from outside of 1/Γ cone with a low local PD increases (for reference, see the f parameter defined in Lan & Dai (2020)). In addition, the PD also depends strongly on the magnetic field configuration within the 1/Γ cone, which is important for the toroidal configuration. In our fitting, we set θj at its typical value of 0.1 rad. The value of the bulk Lorentz factor still cannot be determined. We took GRB 160802A as an example. The predicted time-integrated PDs are similar for the four parameter sets of (Γ0, θj). They are 49.63%, 46.58%, 53.69% and 54.17% for (250, 0.1 rad), (100, 0.1 rad), (250, 0.01 rad), and (100, 0.01 rad), respectively. The multi- window observations of the burst are also properly fit with all these four parameter sets. There is a degeneracy between the parameters. However, with reasonable parameters, our results of the time- integrated PD are roughly robust.
Out of all 25 GRBs with multi-window observations, we used RMFit v4.3.2 to analyze Fermi/GBM data and obtained the observational light curves and Ep curves. Two GRBs (GRB 160623A and GRB 170127C) that were co-detected by Fermi/GBM and the polarization detectors were excluded after the analysis. For GRB 160623A, only one time bin was obtained within its T90 after the analysis, and time evolution information to further constrain the model parameters is lacking. For GRB 170127C, a positive time-integrated low-energy spectral index was obtained, which led to a negative local PD. This is unphysical. The two GRBs were therefore excluded from our analysis.
The time-resolved multi-window fitting results of the remaining 23 GRBs are shown in Figs. 1 and A.1–A.22. For GRBs 100826A, 160821A, and 170114A, the time-resolved polarization observations were reported, and the time-resolved PAs of these bursts changed by 90° at least once during the bursts (Yonetoku et al. 2011b; Sharma et al. 2019; Zhang et al. 2019; Burgess et al. 2019). We set different orientations of the aligned magnetic fields in the radiating shells for these 3 GRBs to interpret the observations. The fitting details were presented in Wang et al. (2024). Because the reported time of GRB 100826A was not the UTC time (Yonetoku et al. 2011b), the time-resolved polarization observation is not shown in Figure 1. Although the significance is reduced, Chattopadhyay et al. (2022) confirmed the double ∼90° change in PA of GRB 160821A, which was first reported in Sharma et al. (2019). Only an time-integrated PD upper limit was obtained after significant issues, and we therefore adopted for reference the old polarization results. The calculation energy band for the polarizations of GRB 160821A (shown in A.12) is the same as was reported by Sharma et al. (2019), that is, within 100 keV to 300 keV. The calculations of time-integrated PD within the energy band of 100 keV to 600 keV were also made and were consistent with the latest time-integrated PD upper limit (Chattopadhyay et al. 2022). Because the values of r0 are higher than 3 × 1016 cm, the cease radii (roff) for GRB 160821A and GRB 180427A were set at 3 × 1017 cm. For GRB 170206A, the time-integrated PD shows no significant reduction compared to the corresponding three time-resolved PDs. We therefore inferred its PA to be roughly a constant within the duration. We discuss its time-integrated polarization in the next section.
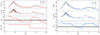 |
Fig. 1. Time-resolved fitting result of GRB 100826A. The left four panels show the light curve, Ep curve, PD curve, and PA curve in proper sequence for the aligned-field case, and the right three panels show the light curve, the evolution of Ep, and the PD curve for the toroidal-field case. The black squares show the observational data. The red circles and lines show our fitting results for the aligned-field case, and the blue lines show the fitting result for the toroidal-field case. The observed time-integrated PD with its 1σ error is shown as a horizontal black line with a gray region, and the predicted PD is shown as a horizontal red (blue) line for the aligned-field (toroidal-field) case. Since the orientation of the GRB and the direction of the aligned field (if any) are stochastic, the predicted time-integrated PAs are not compared with the corresponding observational values for the two cases. |
4.2. The time- and energy-integrated PD
The time-resolved fitting method and results are shown in Section 4.1. With the inferred parameters (shown in ParameterSet) via the fitting of the multi-window observations, the time- and energy-integrated PDs (PDcal, a for the aligned-field case and PDcal, t for the toroidal-field case) of the 23 bursts were obtained, as shown in Fig. 2 for the GAP bursts, in Fig. 3 for the POLAR bursts, and in Fig. 4 for the AstroSat bursts, respectively. For comparison, the time-integrated PDs (PDint) of these bursts calculated with the time-integrated estimation method (Guan & Lan 2023) are also presented. The calculation results are summarized in Table 1. Because the orientations of the GRBs are unknown, the predicted time-integrated PAs are not compared with the corresponding observed values. For the aligned-field case, only the predicted time-resolved PAs are shown. For the toroidal-field case, the predicted time-resolved PA rotates by 90° when the time-resolved PD changes sign.
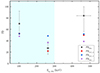 |
Fig. 2. Time-integrated PDs of GRBs observed by GAP. Ep, obs refers to the time-integrated observed value of the spectral peak energy. The black squares, red circles, blue stars, and purple diamonds represent the observational values, the predicted values for the aligned-field case, the predicted values for the toroidal-field case, and the estimated values in Guan & Lan (2023), respectively. The polarizations here are calculated in the energy band from 70 keV to 300 keV. |
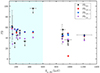 |
Fig. 4. Same as Fig. 2, but for the AstroSat-detected bursts in the energy range of 100 keV to 600 keV. |
For the 20 GRBs without PA rotation observations in our sample, the directions of the aligned fields in the shells of each burst were set to be the same. This leads to a constant time-resolved PA during the main radiation epoch of each burst. The calculated time-resolved and time-integrated PDs of the two cases (toroidal-field case and aligned-field case) are similar. These predicted PDs are the theoretical upper limits. For most of the GRBs (22 of the total 23 GRBs), the predicted time-integrated PDs with two types of MFCs are consistent with the observations. However, one burst (i.e., GRB 110721A) still has an observed lower limit of the time-integrated PD that is higher than the corresponding theoretical upper limit. The PD lower limit of this bursts is given at the 1σ confidence level. Therefore, the models of synchrotron radiation in large-scale ordered magnetic fields (both toroidal and aligned) were rejected at a confidence level of 1σ for this burst. However, the models might be still compatible with the observation at a higher confidence level. The observed time-integrated PDs of 9 of the 20 bursts without observed PA rotation are upper limits and lack time-resolved polarization observations. Since the predicted time- and energy-integrated PDs are the theoretical upper limits, the observed PD upper limits of these 9 bursts do not constrain the model parameters.
The duration of GRB 170206A was divided into three time bins for the polarization analysis, and the observational PDs of these three time bins are  ,
,  , and
, and  , respectively (Kole et al. 2020). The observational time-integrated PD is
  . Compared with the time-resolved PDs, there is no reduction. We therefore inferred that the time-resolved PA is roughly constant during the burst duration. The predicted time-resolved and time-integrated PDs of the burst are ∼39% for the two MFC cases, which is higher than the observed upper limit within 1σ. The observed time-resolved and the time-integrated PDs are therefore lower than the corresponding predicted values. The polarization observations of the burst indicated that the magnetic field is probably mixed in all its radiating shells. A similar condition exists for the first time bin of GRB 170114A, where the corresponding calculated PD for the aligned-field case (42.42%) is too high compared with the observed value (
 ). The polarization observations of the two bursts suggest that the magnetic field is mixed in at least some of the GRB radiation regions.
The PAs of the three bursts (i.e., GRB 100826A, GRB 160821A, and GRB 170114A) were observed to rotate with time (Yonetoku et al. 2011b; Zhang et al. 2019; Kole et al. 2020; Sharma et al. 2019; Chattopadhyay et al. 2022). To interpret these observations, the directions of the aligned magnetic fields in the adjacent shells with a 90° PA rotation observation were assumed to be differently by 90°. This assumption leads to a reduced total polarized flux and hence to lower final time-integrated PDs. The observed time-integrated PDs for GRB 100826A and GRB 170114A are  and
and  , respectively (Yonetoku et al. 2011b; Kole et al. 2020). For GRB 160821A, only an upper limit of 33.87% was obtained (Chattopadhyay et al. 2022). The predicted values for the aligned-field case are 21.87% for GRB 100826A, 5.44% for GRB 160821A, and 11.68% for GRB 170114A. They are consistent with the observations, especially with the observed best-fit values. For the toroidal-field case, the predicted time-integrated PD upper limits are 48.48% for GRB 100826A, 44.76% for GRB 160821A, and 54.16% for GRB 170114A. The predicted time-resolved PAs are constants for these three bursts. Although the predicted time-integrated PDs do not contradict the observations, the observed PA rotations of these three bursts cannot be recovered. Therefore, only the aligned-field case with different field orientations in the radiating shells can interpret the observed polarization properties of these three bursts. Since the aligned field is related to the magnetar central engine (Spruit et al. 2001), as stated in a companion paper Wang et al. (2024), the magnetar central engines are favored for these three bursts.
5. Conclusions and discussion
We predicted the time-integrated polarizations of 23 GRBs via the multi-window fitting. For the aligned-field case, the directions of the large-scale ordered aligned magnetic fields in the shells of the individual burst were set to be the same for the bursts without observed PA rotation(s). The calculated PDs for these bursts are therefore upper limits. For the large-scale ordered toroidal-field case, the predicted time-resolved and time-integrated PDs here are also upper limits. For the bursts without PA rotation observations, the predicted PD upper limits are similar for the two MFC cases. Although there is degeneracy between the parameters, the predicted time-integrated PDs with different sets of the parameters are roughly similar. Our results for the time-integrated PD are robust in general.
Four out of a total of 23 bursts have time-resolved PA observations. Because the time-integrated PD is comparable to its time-resolved PDs, we inferred that the time-resolved PA for GRB 170206A is a constant. The observed best-fit values of the time-resolved and time-integrated PDs are both lower than the corresponding predicted upper limits. Therefore, we inferred that the radiation regions of this burst contain mixed magnetic fields. The time-resolved PAs of 3 of these 4 bursts show strong (∼90°) rotation(s), which reduces the time-integrated PDs. The observed PA rotations and the best-fit values of the time-integrated PD of these 3 bursts were recovered in the aligned-field case with different orientations of the fields in the shells. The toroidal-field case was unable to interpret the polarization observations of these 3 bursts. If the current polarization measurements for these bursts with strong (∼90°) PA rotations are roughly credible, the MFC in the radiation regions of these bursts need to be dominated by a large-scale ordered aligned-field component to match the observed time-integrated PD and the strong time-resolved (∼90°) PA rotations.
The predicted average values of the time-integrated PD here are about 44% for the aligned-field case and about 49% for the toroidal-field case. These are higher than the results of 37.4% in Guan & Lan (2023). Compared to the constant time-resolved PAs predicted in the toroidal-field case, the predicted PA rotations of the aligned-field case lead to a lower average value of the time-integrated PD. The results of the time-integrated estimation method used in Guan & Lan (2023), Toma et al. (2009) are relatively smaller than the results here. Because the predicted time-resolved PA is a constant during the main radiation epoch of each burst for the toroidal-field case, the result here is comparable to that of 50% in Sui & Lan (2024). Compared with the typical or fiducial parameters used in Sui & Lan (2024), the model parameters were inferred from the multi-window fitting here. Although the time-integrated PDs were both obtained via the time-resolved PDs here and in Sui & Lan (2024), the results here are probably more accurate, especially for bursts with PA rotations.
For most of the bursts (22 out of total 23 bursts) in our sample, the predicted time- and energy-integrated PDs match the corresponding observations. There are no time-resolved PA observations or the time-resolved PA is indicated to be a constant for 19 of these 22 bursts. The aligned-field case and the toroidal-field case can both interpret the observational data of these 19 bursts equally well. However, the calculated upper limits for the time-integrated PD of one burst in our sample are lower than the corresponding observed lower limit at a confidence level of 1σ. Since the observational errors of the polarizations are large and the confidence level is relatively low, it is unclear whether the models of the synchrotron emission in ordered magnetic fields are rejected for this burst. Finally, the synchrotron radiation in ordered magnetic field(s) can interpret the multi-window observations of most bursts in our sample. Future accurate polarization measurements will place strict constraints on the MFC in the radiation region and on the origin of the GRBs.
6. Data availability
The parameters used in the time-resolved multi-window fitting can be found in https://zenodo.org/records/14649211.
When it contains an ordered and a random component (Lan et al. 2019).
The magnetic axis of the magnetar is perpendicular to its rotational axis.
Acknowledgments
We thank the anonymous referee for useful suggestions. We are grateful for the GRB data of Fermi/GBM, GAP, POLAR and AstroSat. This work is supported by the National Natural Science Foundation of China (grant Nos. 12473040, 11903014, 12321003, 12393810, 11833003, 11903017 and 12065017), the National Key Research and Development Program of China (grant no. 2017YFA0402600), the National SKA Program of China No. 2020SKA0120300, International Partnership Program of Chinese Academy of Sciences for Grand Challenges (114332KYSB20210018), Jiangxi Provincial Natural Science Foundation under grant 20224ACB211001 and the Major Science and Technology Project of Qinghai Province (2019-ZJ-A10). M.X.L also would like to appreciate the financial support from Jilin University.
References
- Band, D., Matteson, J., Ford, L., Schaefer, B., & Palmer, D. 1993, ApJ, 413, 281 [NASA ADS] [CrossRef] [Google Scholar]
- Burgess, J. M., Kole, M., Berlato, F., et al. 2019, A&A, 627, A105 [NASA ADS] [CrossRef] [EDP Sciences] [Google Scholar]
- Chattopadhyay, T., Gupta, S., Iyyani, S., et al. 2022, ApJ, 936, 12 [NASA ADS] [CrossRef] [Google Scholar]
- Cheng, K., Zhao, X., Mao, J., & Chen, Z. 2024, A&A, 687, A128 [NASA ADS] [CrossRef] [EDP Sciences] [Google Scholar]
- Daigne, F., Bošnjak, & Dubus, G. 2009, in Gamma-ray Burst: Sixth Huntsville Symposium, eds. C. Meegan, C. Kouveliotou, & N. Gehrels (AIP), AIP Conf. Ser., 1133, 288 [NASA ADS] [CrossRef] [Google Scholar]
- Drenkhahn, G. 2002, A&A, 387, 714 [NASA ADS] [CrossRef] [EDP Sciences] [Google Scholar]
- Eichler, D., & Levinson, A. 2000, ApJ, 529, 146 [NASA ADS] [CrossRef] [Google Scholar]
- Ford, L. A., Band, D. L., Matteson, J. L., et al. 1995, ApJ, 439, 307 [NASA ADS] [CrossRef] [Google Scholar]
- Gamma-ray astronomy Group 2014, rmfit: Forward-folding spectral analysis software, Astrophysics Source Code Library [record ascl:1409.011] [Google Scholar]
- Giannios, D. 2008, A&A, 480, 305 [NASA ADS] [CrossRef] [EDP Sciences] [Google Scholar]
- Gill, R., Granot, J., & Kumar, P. 2020, MNRAS, 491, 3343 [Google Scholar]
- Gill, R., Kole, M., & Granot, J. 2021, Galaxies, 9, 82 [NASA ADS] [CrossRef] [Google Scholar]
- Granot, J. 2003, ApJ, 596, L17 [NASA ADS] [CrossRef] [Google Scholar]
- Guan, R. Y., & Lan, M. X. 2023, A&A, 670, A160 [NASA ADS] [CrossRef] [EDP Sciences] [Google Scholar]
- Kaneko, Y., Preece, R. D., Briggs, M. S., et al. 2006, ApJS, 166, 298 [CrossRef] [Google Scholar]
- Kole, M., Angelis, N. D., Berlato, F., et al. 2020, A&A, 644, A124 [NASA ADS] [CrossRef] [EDP Sciences] [Google Scholar]
- Lan, M.-X., & Dai, Z.-G. 2020, ApJ, 892, 141 [NASA ADS] [CrossRef] [Google Scholar]
- Lan, M.-X., Wu, X.-F., & Dai, Z.-G. 2018, ApJ, 860, 44 [NASA ADS] [CrossRef] [Google Scholar]
- Lan, M.-X., Geng, J.-J., Wu, X.-F., & Dai, Z.-G. 2019, ApJ, 870, 96 [NASA ADS] [CrossRef] [Google Scholar]
- Lan, M.-X., Wang, H.-B., Xu, S., Liu, S., & Wu, X.-F. 2021a, ApJ, 909, 184 [NASA ADS] [CrossRef] [Google Scholar]
- Lan, M.-X., Wu, X.-F., & Dai, Z.-G. 2021b, RAA, 21, 055 [NASA ADS] [Google Scholar]
- Lazzati, D. 2006, New J. Phys., 8, 131 [CrossRef] [Google Scholar]
- Li, J.-S., Lan, M.-X., & Wang, H.-B. 2024a, ApJ, 970, 10 [NASA ADS] [CrossRef] [Google Scholar]
- Li, J.-S., Wang, H.-B., & Lan, M.-X. 2024b, ApJ, 973, 2 [NASA ADS] [CrossRef] [Google Scholar]
- Liang, E., & Kargatis, V. 1996, Nature, 381, 49 [NASA ADS] [CrossRef] [Google Scholar]
- Lloyd-Ronning, N. M., Aykutalp, A., & Johnson, J. L. 2019, MNRAS, 488, 5823 [NASA ADS] [CrossRef] [Google Scholar]
- Lu, R. J., Hou, S. J., & Liang, E.-W. 2010, ApJ, 720, 1146 [NASA ADS] [CrossRef] [Google Scholar]
- Lu, R.-J., Wei, J.-J., Liang, E.-W., et al. 2012, ApJ, 756, 112 [Google Scholar]
- Lu, R.-J., Liang, Y.-F., Lin, D.-B., et al. 2018, ApJ, 865, 153 [NASA ADS] [CrossRef] [Google Scholar]
- Lundman, C., Vurm, I., & Beloborodov, A. M. 2018, ApJ, 856, 145 [NASA ADS] [CrossRef] [Google Scholar]
- Mészáros, P., & Rees, M. J. 2000, ApJ, 530, 292 [Google Scholar]
- Murakami, T., Yonetoku, D., Sakashita, T., et al. 2010, in Deciphering the Ancient Universe with Gamma-ray Bursts, eds. N. Kawai, & S. Nagataki(AIP), AIP Conf. Ser., 1279, 227 [NASA ADS] [Google Scholar]
- Narayan, R., Paczynski, B., & Piran, T. 1992, ApJ, 395, L83 [NASA ADS] [CrossRef] [Google Scholar]
- Paczynski, B., & Xu, G. 1994, ApJ, 427, 708 [NASA ADS] [CrossRef] [Google Scholar]
- Parsotan, T., & Lazzati, D. 2022, ApJ, 926, 104 [NASA ADS] [CrossRef] [Google Scholar]
- Parsotan, T., López-Cámara, D., & Lazzati, D. 2020, ApJ, 896, 139 [NASA ADS] [CrossRef] [Google Scholar]
- Produit, N., Bao, T. W., Batsch, T., et al. 2018, Nucl. Instrum. Methods Phys. Res. A, 877, 259 [CrossRef] [Google Scholar]
- Rees, M. J., & Meszaros, P. 1994, ApJ, 430, L93 [Google Scholar]
- Rossi, E. M., Lazzati, D., Salmonson, J. D., & Ghisellini, G. 2004, MNRAS, 354, 86 [NASA ADS] [CrossRef] [Google Scholar]
- Rouco Escorial, A., Fong, W., Berger, E., et al. 2023, ApJ, 959, 13 [NASA ADS] [CrossRef] [Google Scholar]
- Sharma, V., Iyyani, S., Bhattacharya, D., et al. 2019, ApJ, 882, L10 [NASA ADS] [CrossRef] [Google Scholar]
- Spruit, H. C., Daigne, F., & Drenkhahn, G. 2001, A&A, 369, 694 [NASA ADS] [CrossRef] [EDP Sciences] [Google Scholar]
- Sui, L. Q., & Lan, M. X. 2024, MNRAS, submitted [arXiv:2403.10718] [Google Scholar]
- Thompson, C. 1994, MNRAS, 270, 480 [NASA ADS] [CrossRef] [Google Scholar]
- Toma, K., Sakamoto, T., Zhang, B., et al. 2009, ApJ, 698, 1042 [NASA ADS] [CrossRef] [Google Scholar]
- Uhm, Z. L., Zhang, B., & Racusin, J. 2018, ApJ, 869, 100 [NASA ADS] [CrossRef] [Google Scholar]
- von Kienlin, A., Meegan, C. A., Paciesas, W. S., et al. 2020, ApJ, 893, 46 [Google Scholar]
- Wang, X., Lan, M.-X., Tang, Q.-W., Wu, X.-F., & Dai, Z.-G. 2024, ApJ, 972, 15 [NASA ADS] [CrossRef] [Google Scholar]
- Waxman, E. 2003, Nature, 423, 388 [NASA ADS] [CrossRef] [Google Scholar]
- Yonetoku, D., Murakami, T., Masui, H., et al. 2006, in Space Telescopes and Instrumentation II: Ultraviolet to Gamma Ray, eds. M. J. L. Turner, & G. Hasinger, SPIE Conf. Ser., 6266, 62662C [NASA ADS] [CrossRef] [Google Scholar]
- Yonetoku, D., Murakami, T., Gunji, S., et al. 2011a, PASJ, 63, 625 [Google Scholar]
- Yonetoku, D., Murakami, T., Gunji, S., et al. 2011b, ApJ, 743, L30 [NASA ADS] [CrossRef] [Google Scholar]
- Yonetoku, D., Murakami, T., Gunji, S., et al. 2012, ApJ, 758, L1 [NASA ADS] [CrossRef] [Google Scholar]
- Zhang, B., & Yan, H. 2011, ApJ, 726, 90 [Google Scholar]
- Zhang, S.-N., Kole, M., Bao, T.-W., et al. 2019, Nat. Astron., 3, 258 [CrossRef] [Google Scholar]
Appendix A: Figures of the time-resolved fitting results of the remaining 22 GRBs
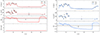 |
Fig. A.10. Same as Figure. 1, but for GRB 160325A. |
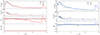 |
Fig. A.11. Same as Figure. 1, but for GRB 160802A. |
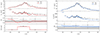 |
Fig. A.12. Same as Figure 1, but for GRB 160821A. The calculated energy range for the time-resolved PD and PA is (100 keV, 300 keV) as in Sharma et al. (2019), which is different from (100 keV, 600 keV) of the time-integrated results in Table 1. |
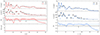 |
Fig. A.13. Same as Figure. 1, but for GRB 170527A. |
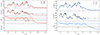 |
Fig. A.14. Same as Figure. 1, but for GRB 171010A. |
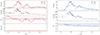 |
Fig. A.15. Same as Figure. 1, but for GRB 171227A. |
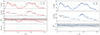 |
Fig. A.16. Same as Figure. 1, but for GRB 180120A. |
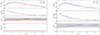 |
Fig. A.17. Same as Figure. 1, but for GRB 180427A. |
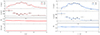 |
Fig. A.18. Same as Figure. 1, but for GRB 180806A. |
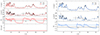 |
Fig. A.19. Same as Figure. 1, but for GRB 180914A. |
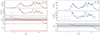 |
Fig. A.20. Same as Figure. 1, but for GRB 190530A. |
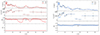 |
Fig. A.21. Same as Figure. 1, but for GRB 200311A. |
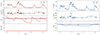 |
Fig. A.22. Same as Figure. 1, but for GRB of 200412A. |
All Tables
All Figures
|
Fig. 1. Time-resolved fitting result of GRB 100826A. The left four panels show the light curve, Ep curve, PD curve, and PA curve in proper sequence for the aligned-field case, and the right three panels show the light curve, the evolution of Ep, and the PD curve for the toroidal-field case. The black squares show the observational data. The red circles and lines show our fitting results for the aligned-field case, and the blue lines show the fitting result for the toroidal-field case. The observed time-integrated PD with its 1σ error is shown as a horizontal black line with a gray region, and the predicted PD is shown as a horizontal red (blue) line for the aligned-field (toroidal-field) case. Since the orientation of the GRB and the direction of the aligned field (if any) are stochastic, the predicted time-integrated PAs are not compared with the corresponding observational values for the two cases. |
| In the text | |
|
Fig. 2. Time-integrated PDs of GRBs observed by GAP. Ep, obs refers to the time-integrated observed value of the spectral peak energy. The black squares, red circles, blue stars, and purple diamonds represent the observational values, the predicted values for the aligned-field case, the predicted values for the toroidal-field case, and the estimated values in Guan & Lan (2023), respectively. The polarizations here are calculated in the energy band from 70 keV to 300 keV. |
| In the text | |
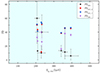 |
Fig. 3. Same as Fig. 2, but for the POLAR-detected bursts in the energy range of 50 keV to 500 keV. |
| In the text | |
|
Fig. 4. Same as Fig. 2, but for the AstroSat-detected bursts in the energy range of 100 keV to 600 keV. |
| In the text | |
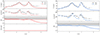 |
Fig. A.1. Same as Figure. 1, but for GRB 110301A. |
| In the text | |
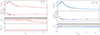 |
Fig. A.2. Same as Figure. 1, but for GRB 110721A. |
| In the text | |
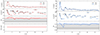 |
Fig. A.3. Same as Figure. 1, but for GRB 161218B. |
| In the text | |
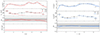 |
Fig. A.4. Same as Figure. 1, but for GRB 170101B. |
| In the text | |
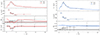 |
Fig. A.5. Same as Figure 1, but for GRB 170114A. |
| In the text | |
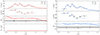 |
Fig. A.6. Same as Figure 1, but for GRB 170206A. |
| In the text | |
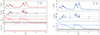 |
Fig. A.7. Same as Figure. 1, but for GRB 170207A. |
| In the text | |
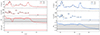 |
Fig. A.8. Same as Figure. 1, but for GRB 170210A. |
| In the text | |
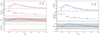 |
Fig. A.9. Same as Figure. 1, but for GRB 170305A. |
| In the text | |
|
Fig. A.10. Same as Figure. 1, but for GRB 160325A. |
| In the text | |
|
Fig. A.11. Same as Figure. 1, but for GRB 160802A. |
| In the text | |
|
Fig. A.12. Same as Figure 1, but for GRB 160821A. The calculated energy range for the time-resolved PD and PA is (100 keV, 300 keV) as in Sharma et al. (2019), which is different from (100 keV, 600 keV) of the time-integrated results in Table 1. |
| In the text | |
|
Fig. A.13. Same as Figure. 1, but for GRB 170527A. |
| In the text | |
|
Fig. A.14. Same as Figure. 1, but for GRB 171010A. |
| In the text | |
|
Fig. A.15. Same as Figure. 1, but for GRB 171227A. |
| In the text | |
|
Fig. A.16. Same as Figure. 1, but for GRB 180120A. |
| In the text | |
|
Fig. A.17. Same as Figure. 1, but for GRB 180427A. |
| In the text | |
|
Fig. A.18. Same as Figure. 1, but for GRB 180806A. |
| In the text | |
|
Fig. A.19. Same as Figure. 1, but for GRB 180914A. |
| In the text | |
|
Fig. A.20. Same as Figure. 1, but for GRB 190530A. |
| In the text | |
|
Fig. A.21. Same as Figure. 1, but for GRB 200311A. |
| In the text | |
|
Fig. A.22. Same as Figure. 1, but for GRB of 200412A. |
| In the text | |
Current usage metrics show cumulative count of Article Views (full-text article views including HTML views, PDF and ePub downloads, according to the available data) and Abstracts Views on Vision4Press platform.
Data correspond to usage on the plateform after 2015. The current usage metrics is available 48-96 hours after online publication and is updated daily on week days.
Initial download of the metrics may take a while.