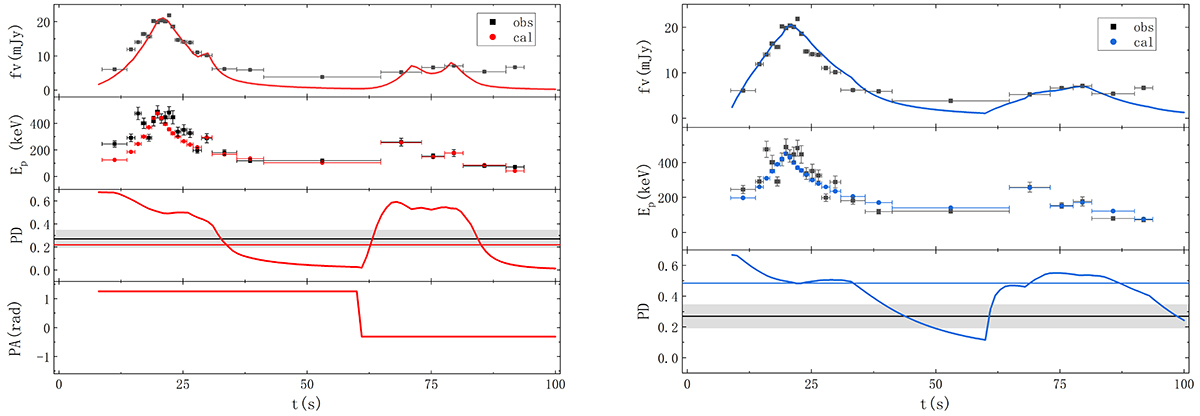
Fig. 1.
Download original image
Time-resolved fitting result of GRB 100826A. The left four panels show the light curve, Ep curve, PD curve, and PA curve in proper sequence for the aligned-field case, and the right three panels show the light curve, the evolution of Ep, and the PD curve for the toroidal-field case. The black squares show the observational data. The red circles and lines show our fitting results for the aligned-field case, and the blue lines show the fitting result for the toroidal-field case. The observed time-integrated PD with its 1σ error is shown as a horizontal black line with a gray region, and the predicted PD is shown as a horizontal red (blue) line for the aligned-field (toroidal-field) case. Since the orientation of the GRB and the direction of the aligned field (if any) are stochastic, the predicted time-integrated PAs are not compared with the corresponding observational values for the two cases.
Current usage metrics show cumulative count of Article Views (full-text article views including HTML views, PDF and ePub downloads, according to the available data) and Abstracts Views on Vision4Press platform.
Data correspond to usage on the plateform after 2015. The current usage metrics is available 48-96 hours after online publication and is updated daily on week days.
Initial download of the metrics may take a while.