Fig. 1.
Download original image
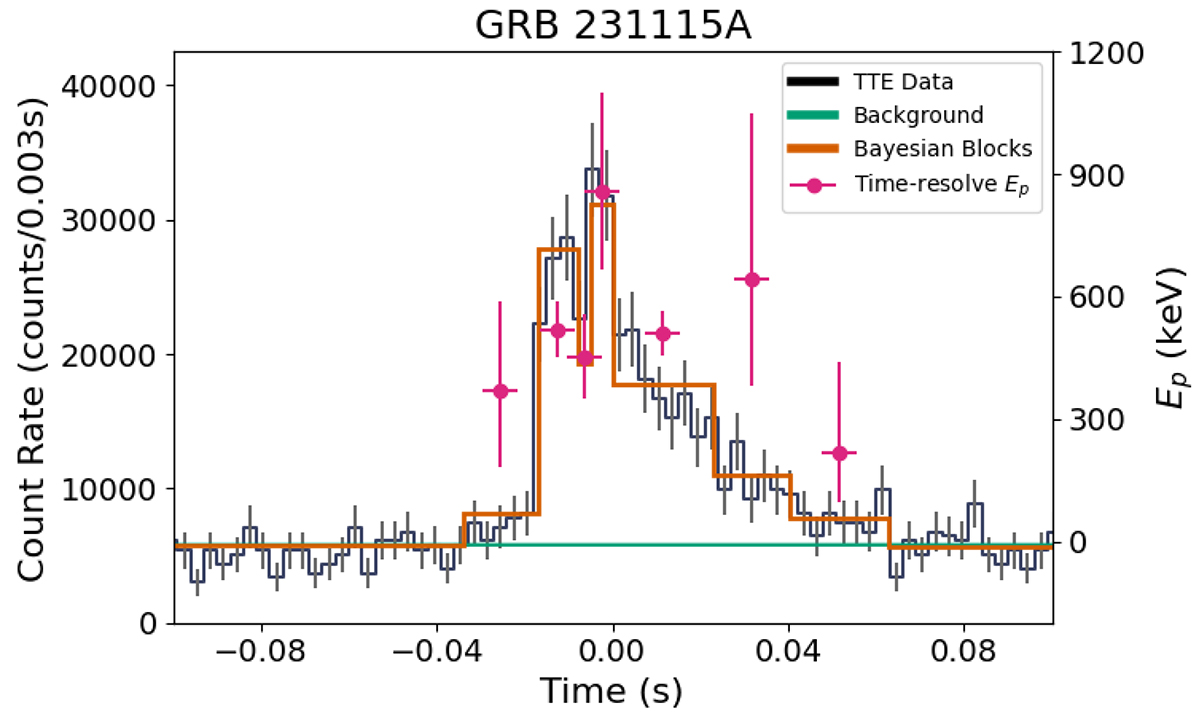
Fermi/GBM light curve of GRB 231115A (black), binned at a temporal resolution of counts per 3 ms, with the background model (green). The brown line is the result of the BB analysis of the burst. The pink dots are the time-resolved peak energy values taken from Table 1. At this finer temporal resolution we see a double-peaked structure within the initial burst signal.
Current usage metrics show cumulative count of Article Views (full-text article views including HTML views, PDF and ePub downloads, according to the available data) and Abstracts Views on Vision4Press platform.
Data correspond to usage on the plateform after 2015. The current usage metrics is available 48-96 hours after online publication and is updated daily on week days.
Initial download of the metrics may take a while.