Fig. 3
Download original image
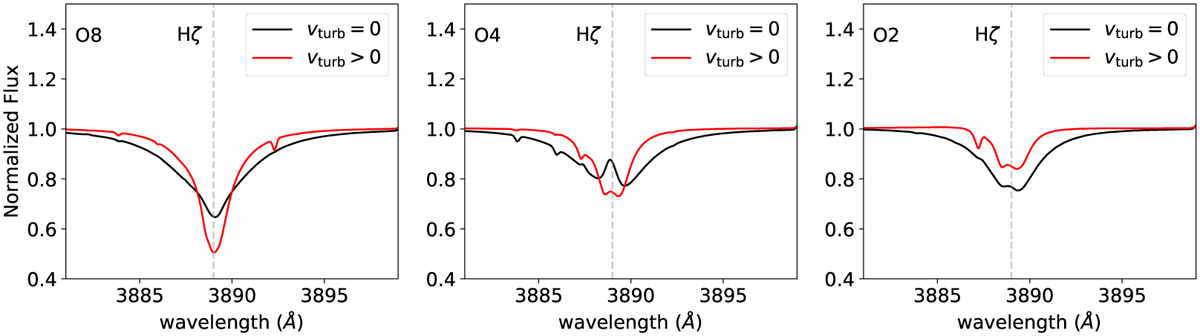
Normalised flux for the HZ line from left to right for the PoWR model spectra calculated for the O8, O4, and O2 models. The red spectrum shows the profile resulting from the model incorporating vturb > 0 to reproduce the 2D average density profile. In black, the spectral lines from a PoWR models with the same parameters, but vturb = 0 is shown.
Current usage metrics show cumulative count of Article Views (full-text article views including HTML views, PDF and ePub downloads, according to the available data) and Abstracts Views on Vision4Press platform.
Data correspond to usage on the plateform after 2015. The current usage metrics is available 48-96 hours after online publication and is updated daily on week days.
Initial download of the metrics may take a while.