Fig. D.1
Download original image
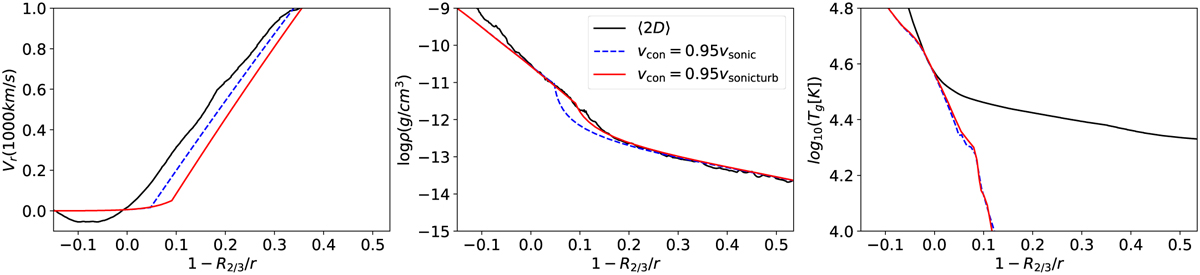
Profile comparison for the O2 model shifting the connection point between the (quasi-)hydrostatic regime and the β–law. Left panel: Wind velocity profile, in solid black for the 2D averaged model of Debnath et al. (2024), solid red for the best-fit 1D PoWR model with vturb > 0 and initial connection point (vturb = 0.95 vsonicturb), in dotted blue for the shifted connection point (vcon = 0.95 vsonic). Middle panel: Same as the left panel, but for the density profile. Right panel: Same as the left panel, but for the gas temperature.
Current usage metrics show cumulative count of Article Views (full-text article views including HTML views, PDF and ePub downloads, according to the available data) and Abstracts Views on Vision4Press platform.
Data correspond to usage on the plateform after 2015. The current usage metrics is available 48-96 hours after online publication and is updated daily on week days.
Initial download of the metrics may take a while.