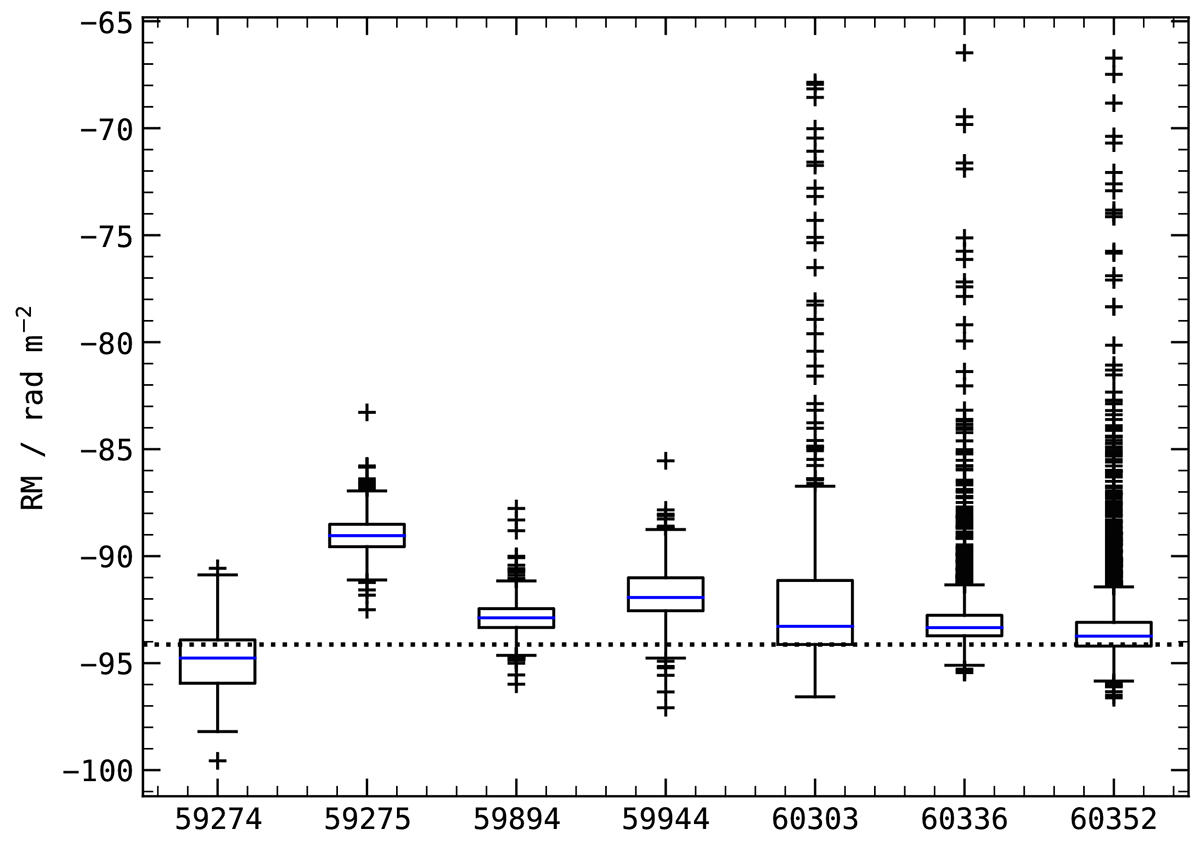
Fig. A.1.
Download original image
Boxplot of ionospheric corrected RM measurements of single pulses from PSR J0139+5814 taken on different days. The blue line in each box denotes the median. Each box spans for Inter-Quartile-Range. The horizontal dotted line is the literature RM value for the pulsar. The large number of outliers on MJDs 60303, 60336 and 60352 is due to the heightened ionospheric activity reported in the GMRT Cycle 45 observations.
Current usage metrics show cumulative count of Article Views (full-text article views including HTML views, PDF and ePub downloads, according to the available data) and Abstracts Views on Vision4Press platform.
Data correspond to usage on the plateform after 2015. The current usage metrics is available 48-96 hours after online publication and is updated daily on week days.
Initial download of the metrics may take a while.