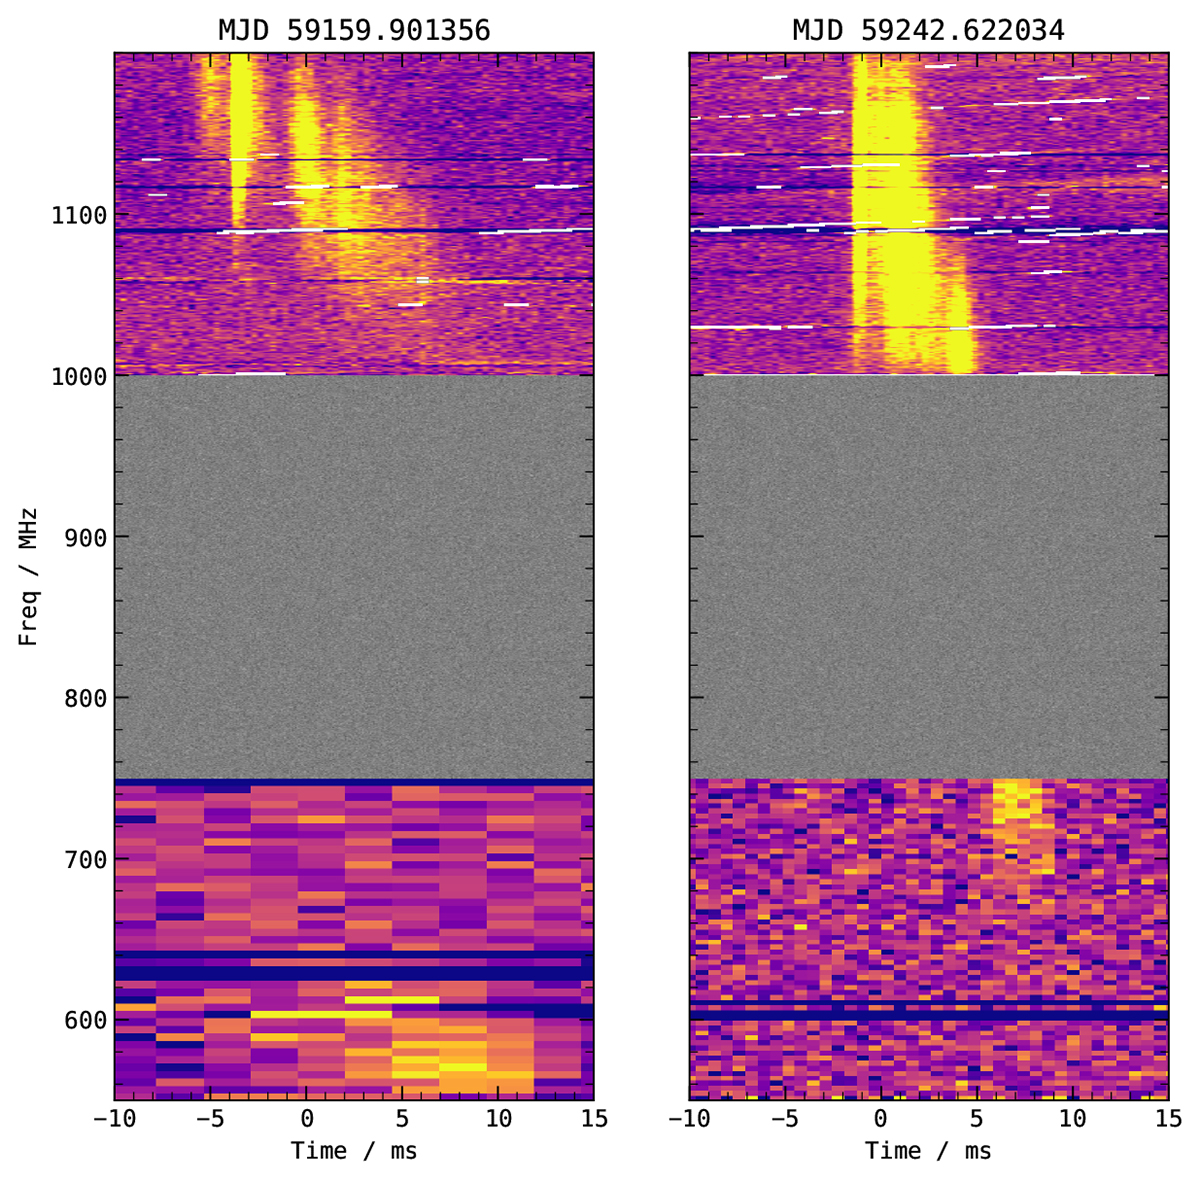
Fig. 4.
Download original image
Time-aligned filterbank data of Band 4 (550–750 MHz) and Band 5 (1000–1200 MHz) showing simultaneous detections. The filterbank data has been de-dispersed to 1200 MHz (top of Band 5). The gray region is random data plotted to show continuity. The white strips are manually flagged RFI. The time-frequency resolution and color-scale have been suitable chosen to clearly display the bursts.
Current usage metrics show cumulative count of Article Views (full-text article views including HTML views, PDF and ePub downloads, according to the available data) and Abstracts Views on Vision4Press platform.
Data correspond to usage on the plateform after 2015. The current usage metrics is available 48-96 hours after online publication and is updated daily on week days.
Initial download of the metrics may take a while.