Fig. 2.
Download original image
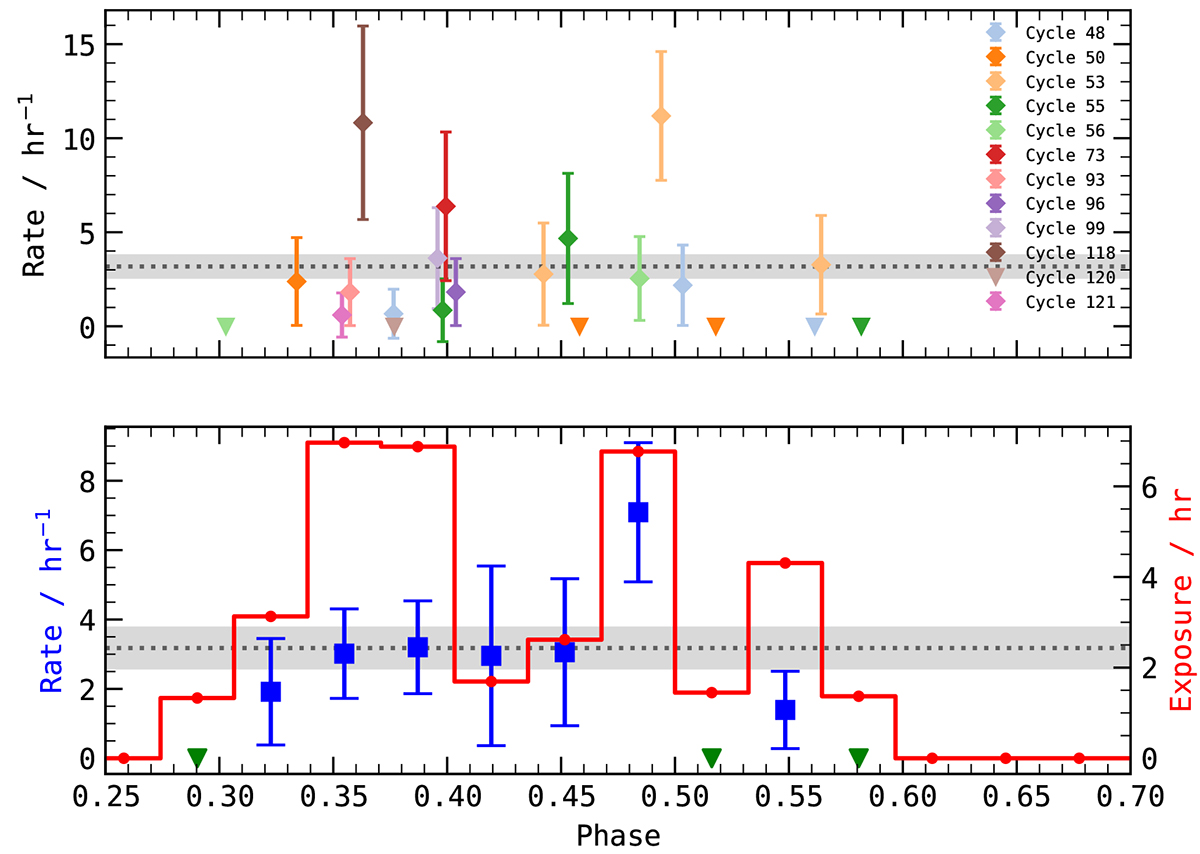
Rate over activity phase of FRB 20180916B. The horizontal dotted black line is the total average rate. The error bars and the shaded region around the horizontal dotted line correspond to 95% error. Top: Rate per phase for each observation color-coded by activity cycle of the source. Detections are marked by diamonds with 95% error bars. Nondetections are marked by triangles. Bottom: Rate over activity phase when all observations are considered (see text for more details). The down-pointing green triangles denote nondetection of bursts. The blue squares correspond to rates with 95% error, with y-axis toward the left. The red circles mark the total exposure at the corresponding phase with y-axis toward the right.
Current usage metrics show cumulative count of Article Views (full-text article views including HTML views, PDF and ePub downloads, according to the available data) and Abstracts Views on Vision4Press platform.
Data correspond to usage on the plateform after 2015. The current usage metrics is available 48-96 hours after online publication and is updated daily on week days.
Initial download of the metrics may take a while.