Fig. 1.
Download original image
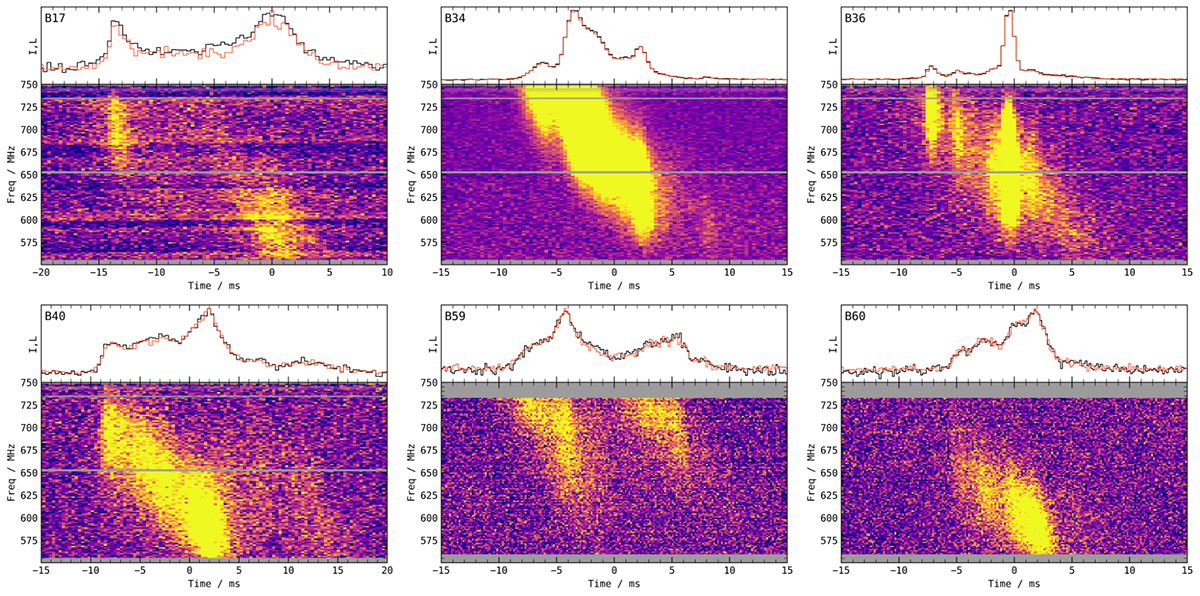
Selection of polarization calibrated bursts. For each burst, we plot the de-dispersed dynamic spectra, frequency averaged total intensity (black) and RM corrected linear polarized (red) time series. The gray bands are RFI channels that have been zapped. The top left text in the time series panels is the burst ID. The rest of the plots can be found on zenodo.
Current usage metrics show cumulative count of Article Views (full-text article views including HTML views, PDF and ePub downloads, according to the available data) and Abstracts Views on Vision4Press platform.
Data correspond to usage on the plateform after 2015. The current usage metrics is available 48-96 hours after online publication and is updated daily on week days.
Initial download of the metrics may take a while.