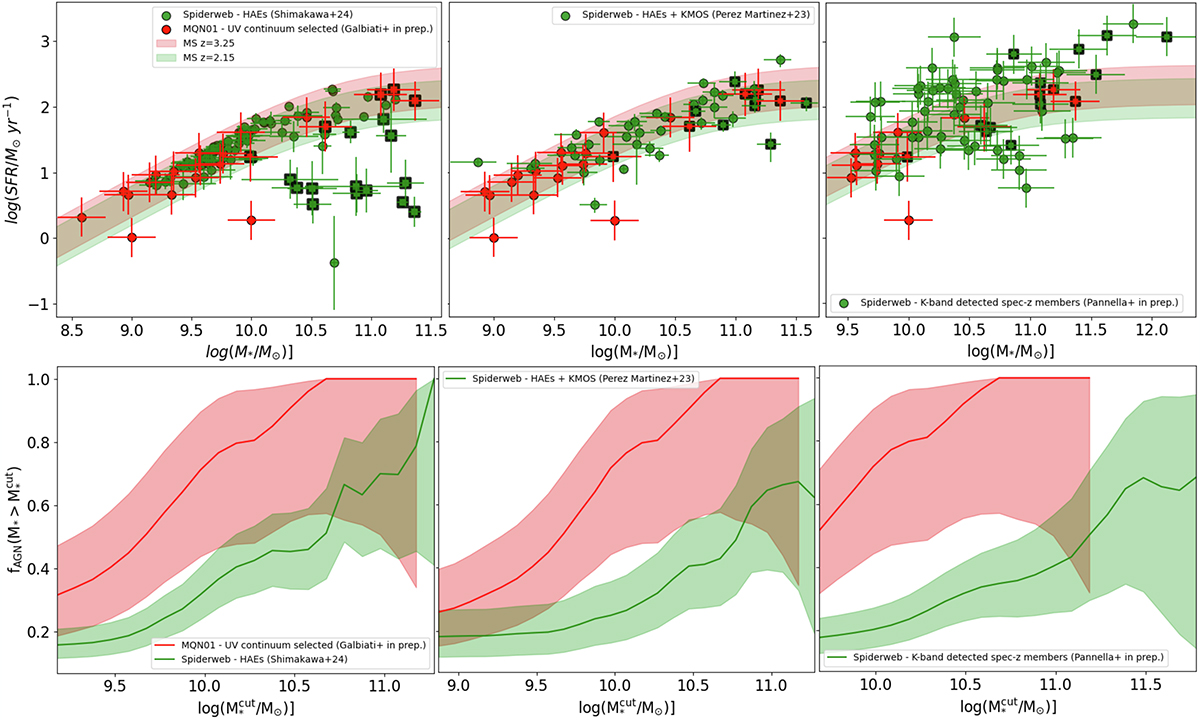
Fig. 9.
Download original image
X-ray AGN fraction versus M* threshold for different star-forming galaxy populations. The top panels display the SFR vs M* plots for galaxies in the MQN01 (red dots) and Spiderweb (green dots) regions. The Spiderweb data were obtained by Shimakawa et al. (2024) (left panel), Pérez-Martínez et al. (2023) (middle panel), and Pannella et al. (in prep.) (right panel). The shaded areas represent the Popesso et al. (2023) main sequence (MS) with a ±0.3 dex spread at redshifts z = 3.25 (red) and z = 2.16 (green). Galaxies hosting an X-ray AGN are highlighted with black-edged squares. The bottom panels show the variation of fAGN as a function of the M* threshold, as indicated by the grid of values on the x-axis.
Current usage metrics show cumulative count of Article Views (full-text article views including HTML views, PDF and ePub downloads, according to the available data) and Abstracts Views on Vision4Press platform.
Data correspond to usage on the plateform after 2015. The current usage metrics is available 48-96 hours after online publication and is updated daily on week days.
Initial download of the metrics may take a while.