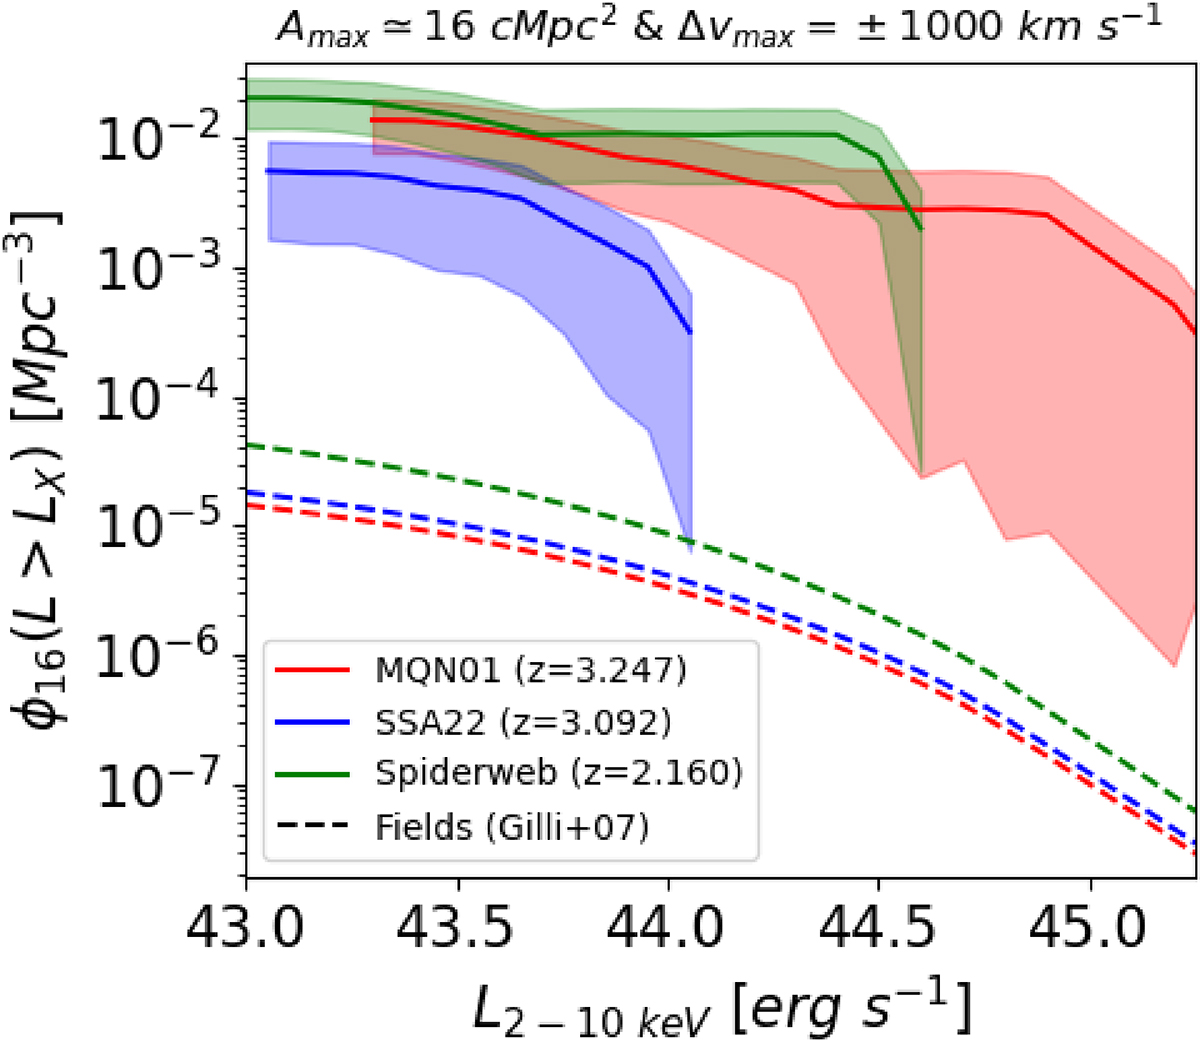
Fig. 7.
Download original image
Cumulative HXLF of AGN in a volume (V16) defined to contain the bulk of the galaxy population in MQN01, with Amax ∼ 16 cMpc2 and Δvmax = ± 1000 km s−1. The red and green lines represent the HXLF estimated for the MQN01 and Spiderweb protoclusters, respectively, centred on the brightest QSOs, CTS G18.01 (ID1) and PSK1138, which are excluded from the analysis. The blue line depicts the HXLF of AGN in the SSA22 protocluster, centred at the location that maximizes the AGN overdensity within V16. The transparent bands indicate the range of values due to Poisson uncertainties. The dashed lines indicate the HXLF of AGN in the field, estimated as in Gilli et al. (2007), with the colours corresponding to the same redshifts as the solid lines for the protoclusters.
Current usage metrics show cumulative count of Article Views (full-text article views including HTML views, PDF and ePub downloads, according to the available data) and Abstracts Views on Vision4Press platform.
Data correspond to usage on the plateform after 2015. The current usage metrics is available 48-96 hours after online publication and is updated daily on week days.
Initial download of the metrics may take a while.