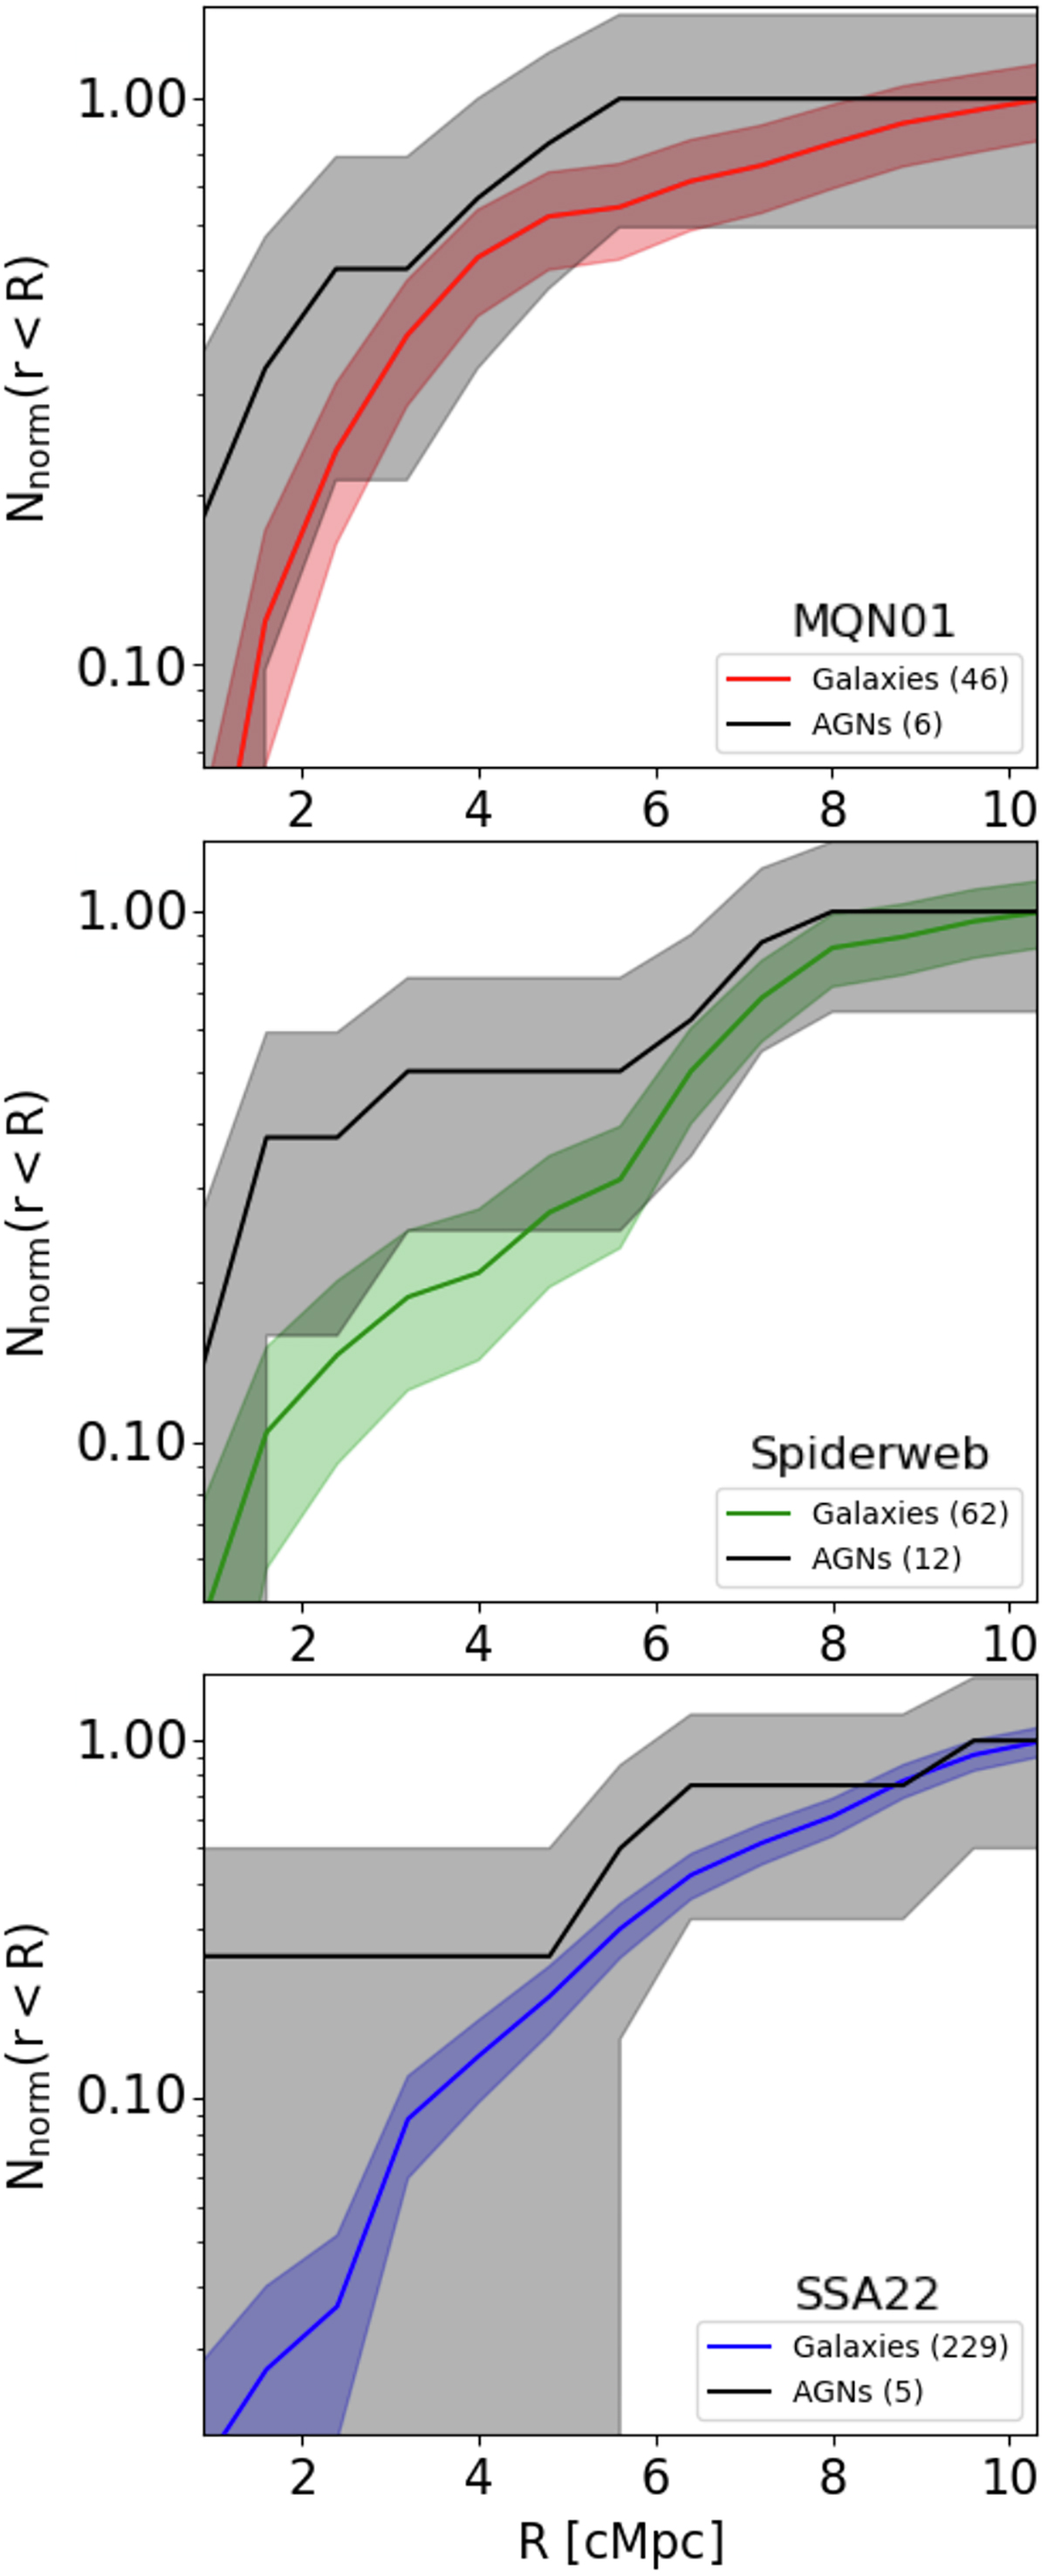
Fig. 6.
Download original image
Radial profiles, normalized to their maximum values, of the cumulative number of galaxies and AGN within a sphere of radius r < R for different protoclusters. The top, middle, and bottom panels display these profiles for galaxies (red, green, blue) and AGN (black) in MQN01, Spiderweb, and SS22, respectively. The transparent bands represent the Poissonian uncertainties in the number of objects within each sphere. The number of galaxies and AGN used to produce these curves are provided in the brackets in the legend of each panel.
Current usage metrics show cumulative count of Article Views (full-text article views including HTML views, PDF and ePub downloads, according to the available data) and Abstracts Views on Vision4Press platform.
Data correspond to usage on the plateform after 2015. The current usage metrics is available 48-96 hours after online publication and is updated daily on week days.
Initial download of the metrics may take a while.