Open Access
Fig. 5.
Download original image
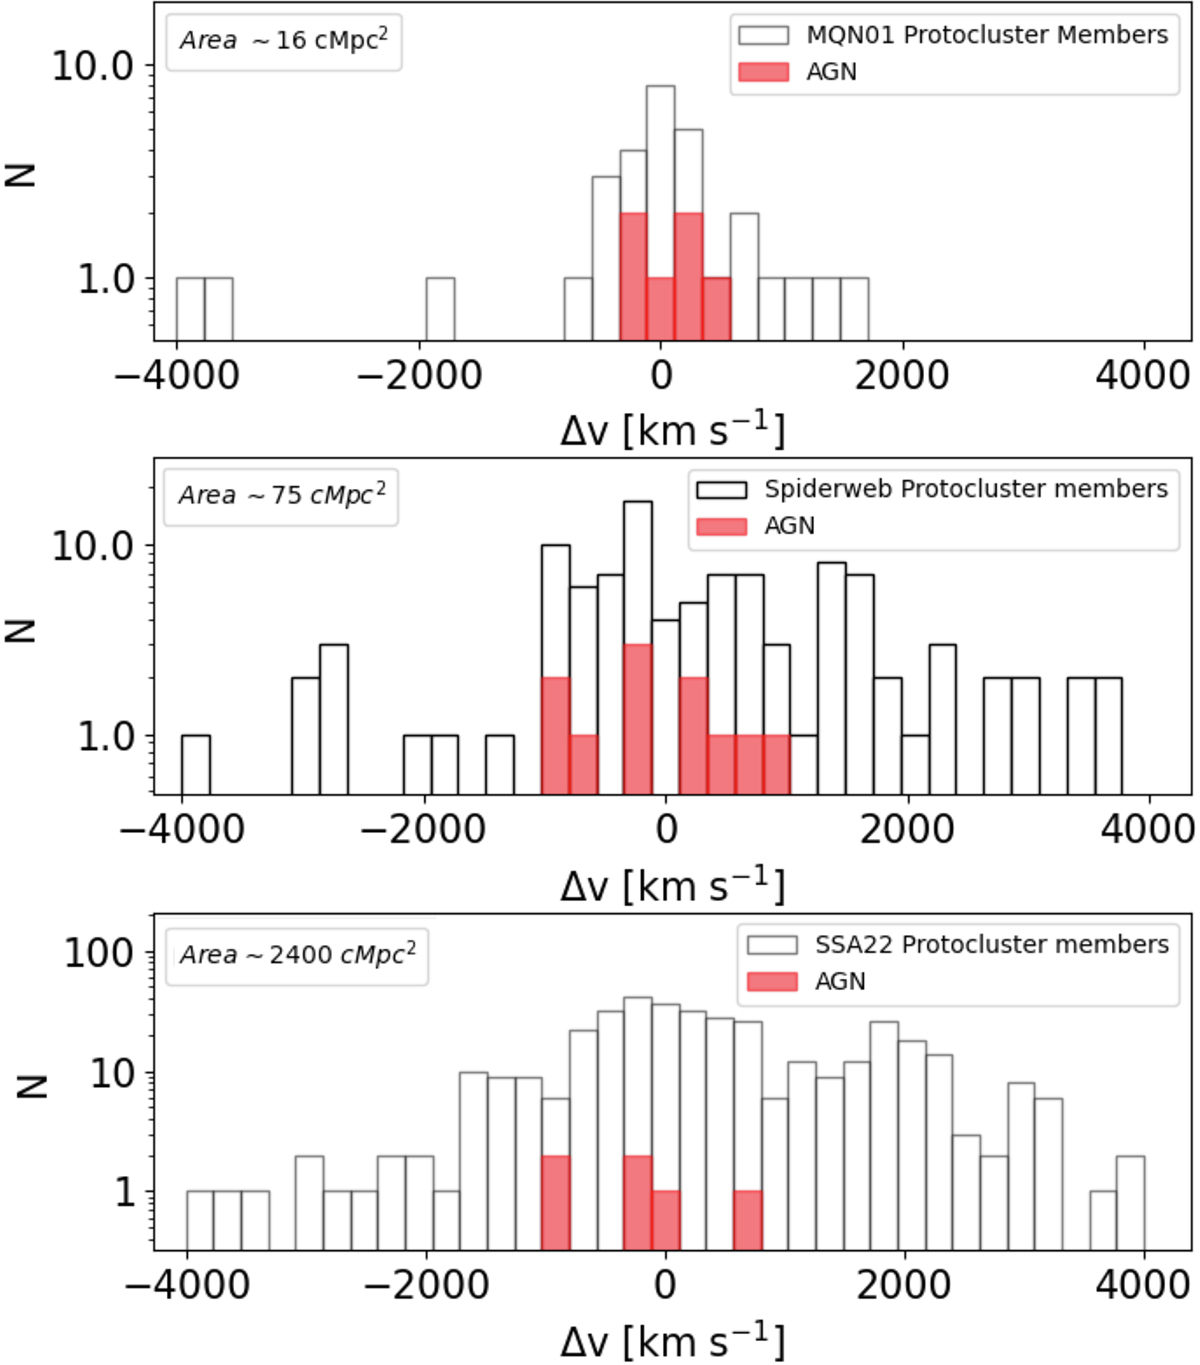
Velocity distribution of the galaxies+AGN (white) and AGN (red) members of the MQN01 (top panel), Spiderweb (middle panel), and SSA22 (bottom panel) protoclusters, in a velocity range ±4000 km s−1 and within areas of approximately 16, 75, and 2400 cMpc2, respectively, as reported in the top left legend of each panel.
Current usage metrics show cumulative count of Article Views (full-text article views including HTML views, PDF and ePub downloads, according to the available data) and Abstracts Views on Vision4Press platform.
Data correspond to usage on the plateform after 2015. The current usage metrics is available 48-96 hours after online publication and is updated daily on week days.
Initial download of the metrics may take a while.