Fig. 4.
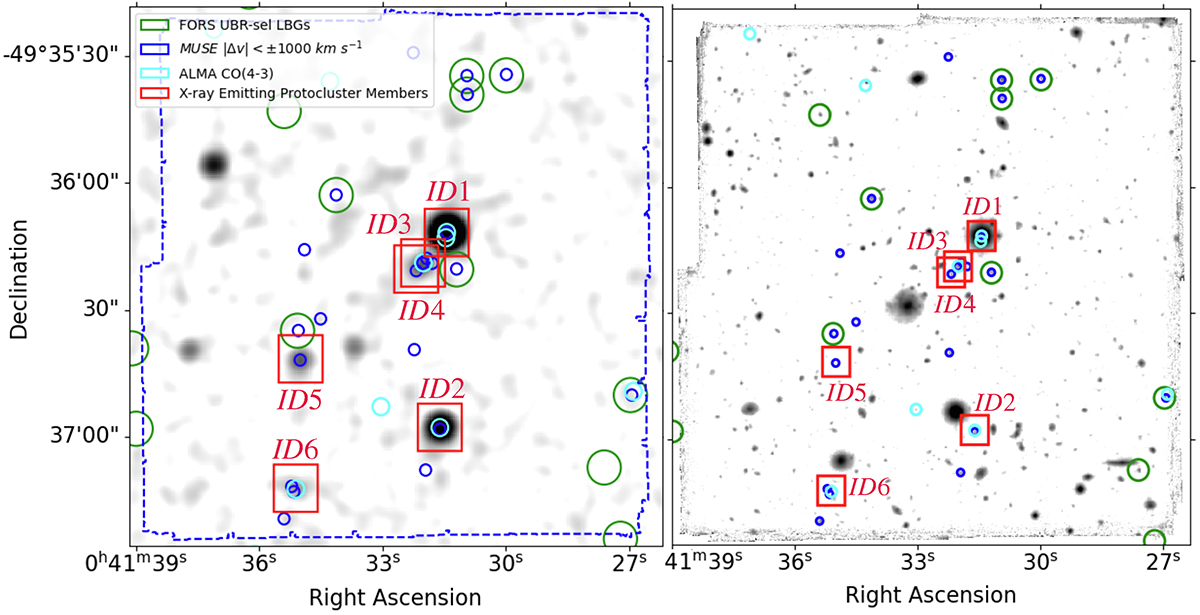
Download original image
Chandra X-ray and MUSE images of the MUSE field with symbols marking Chandra X-ray point sources and MQN01 protocluster membership candidates identified through spectroscopic and photometric methods. On the left, a 2 pixel Gaussian kernel-convolved image at the energy band of 0.5–10 keV, zoomed into the MUSE FoV (blue dashed square and blue square in Fig. 1). The red squares mark the X-ray point sources detected with S/N ≥ 3, each associated with an identity number. The blue and cyan circles show the spectroscopically confirmed MQN01 protocluster members within ±1500 km s−1 from the QSO CTS G18.01 (ID1) from MUSE (Galbiati et al. 2024) and within ±4000 km s−1 from ALMA (Pensabene et al. 2024), respectively. The green circles indicate the positions of FORS photometrically selected protocluster member candidates (Galbiati et al. 2024). The right panel shows the MUSE White Light Image of the same field with the same markers for multi-wavelength selections.
Current usage metrics show cumulative count of Article Views (full-text article views including HTML views, PDF and ePub downloads, according to the available data) and Abstracts Views on Vision4Press platform.
Data correspond to usage on the plateform after 2015. The current usage metrics is available 48-96 hours after online publication and is updated daily on week days.
Initial download of the metrics may take a while.