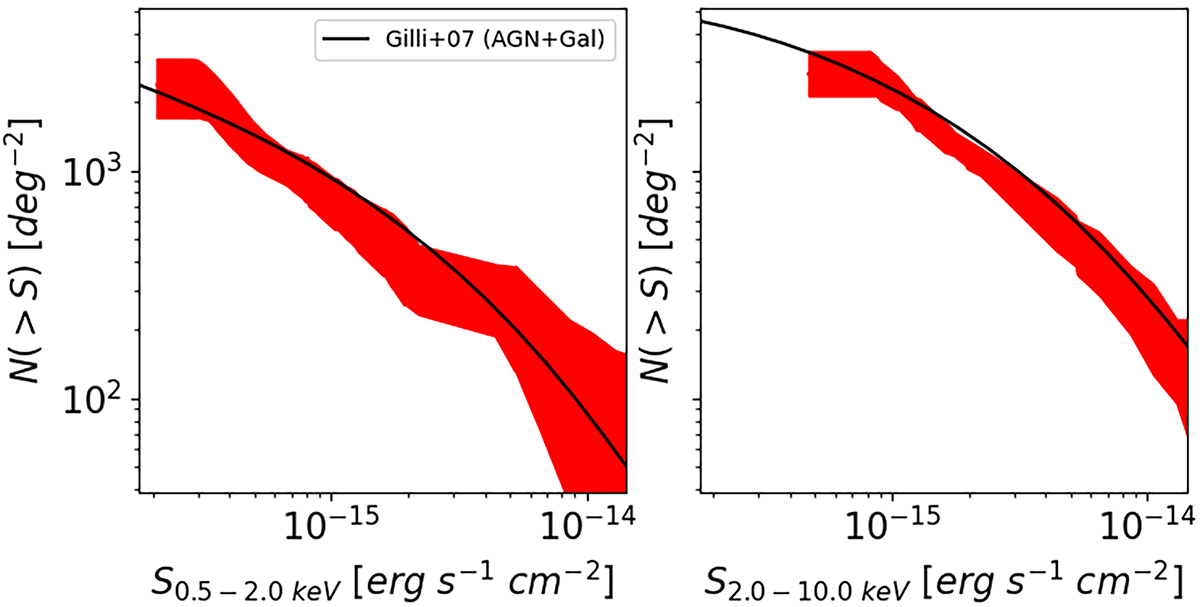
Fig. 3.
Download original image
Cumulative number of counts in the soft (left) and hard (2–10 keV; right) energy band, derived within a distance of 6 arcmin from the aim point in the Chandra data of MQN01. The red shaded area shows the uncertainties within 1σ due to photometric errors. The black line shows the number of counts predicted for the field from the AGN+Galaxy models developed in Gilli et al. (2007).
Current usage metrics show cumulative count of Article Views (full-text article views including HTML views, PDF and ePub downloads, according to the available data) and Abstracts Views on Vision4Press platform.
Data correspond to usage on the plateform after 2015. The current usage metrics is available 48-96 hours after online publication and is updated daily on week days.
Initial download of the metrics may take a while.