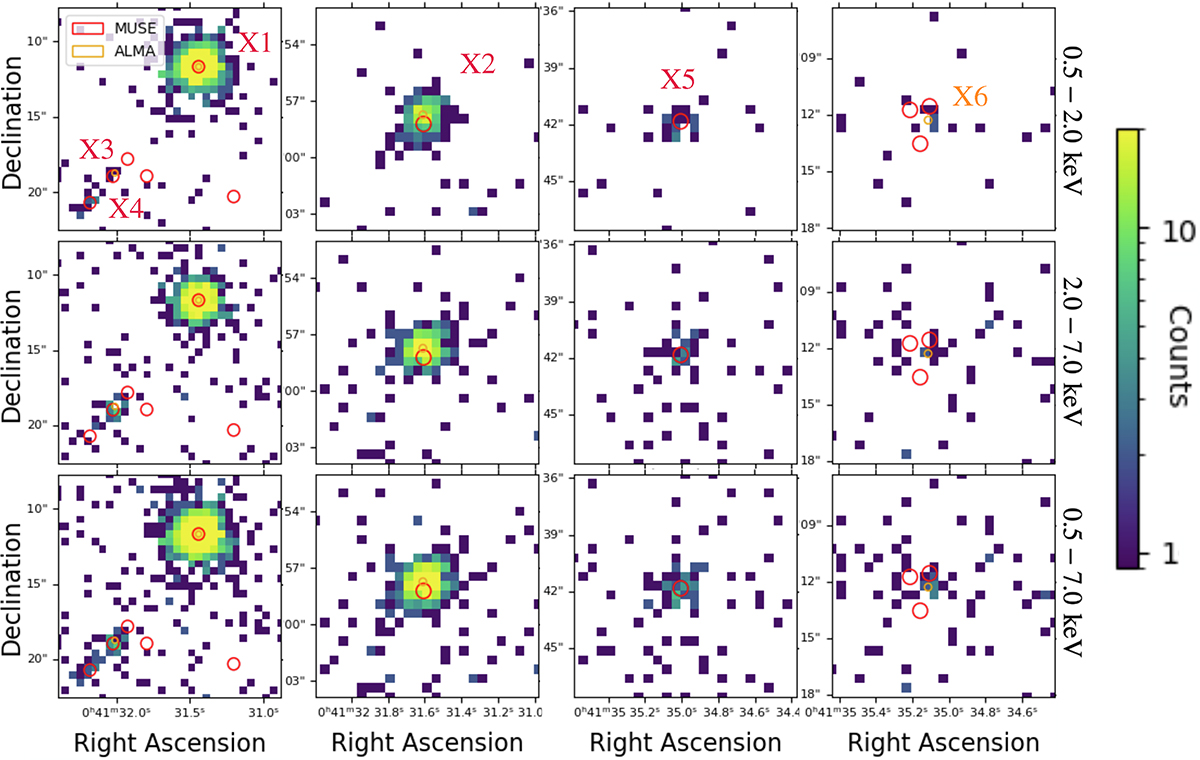
Fig. A.1.
Download original image
Chandra X-ray images (in counts) focusing on the six X-ray sources associated with spectroscopically selected protocluster members. The images are binned in energy bands: soft (0.5-2.0 keV) in the top panels; hard (2.0-7.0 keV) in the central panels; and broad (0.5-7.0 keV) in the bottom panels. The red and orange circles denote the protocluster members identified through spectroscopic selection with MUSE and ALMA, respectively. The first column depicts the region of the three closely located X-ray detections within a FoV of 115 × 115 kpc2, while the subsequent columns present FoVs of approximately 92 × 92 kpc2, centred on the other detections.
Current usage metrics show cumulative count of Article Views (full-text article views including HTML views, PDF and ePub downloads, according to the available data) and Abstracts Views on Vision4Press platform.
Data correspond to usage on the plateform after 2015. The current usage metrics is available 48-96 hours after online publication and is updated daily on week days.
Initial download of the metrics may take a while.