Fig. 11.
Download original image
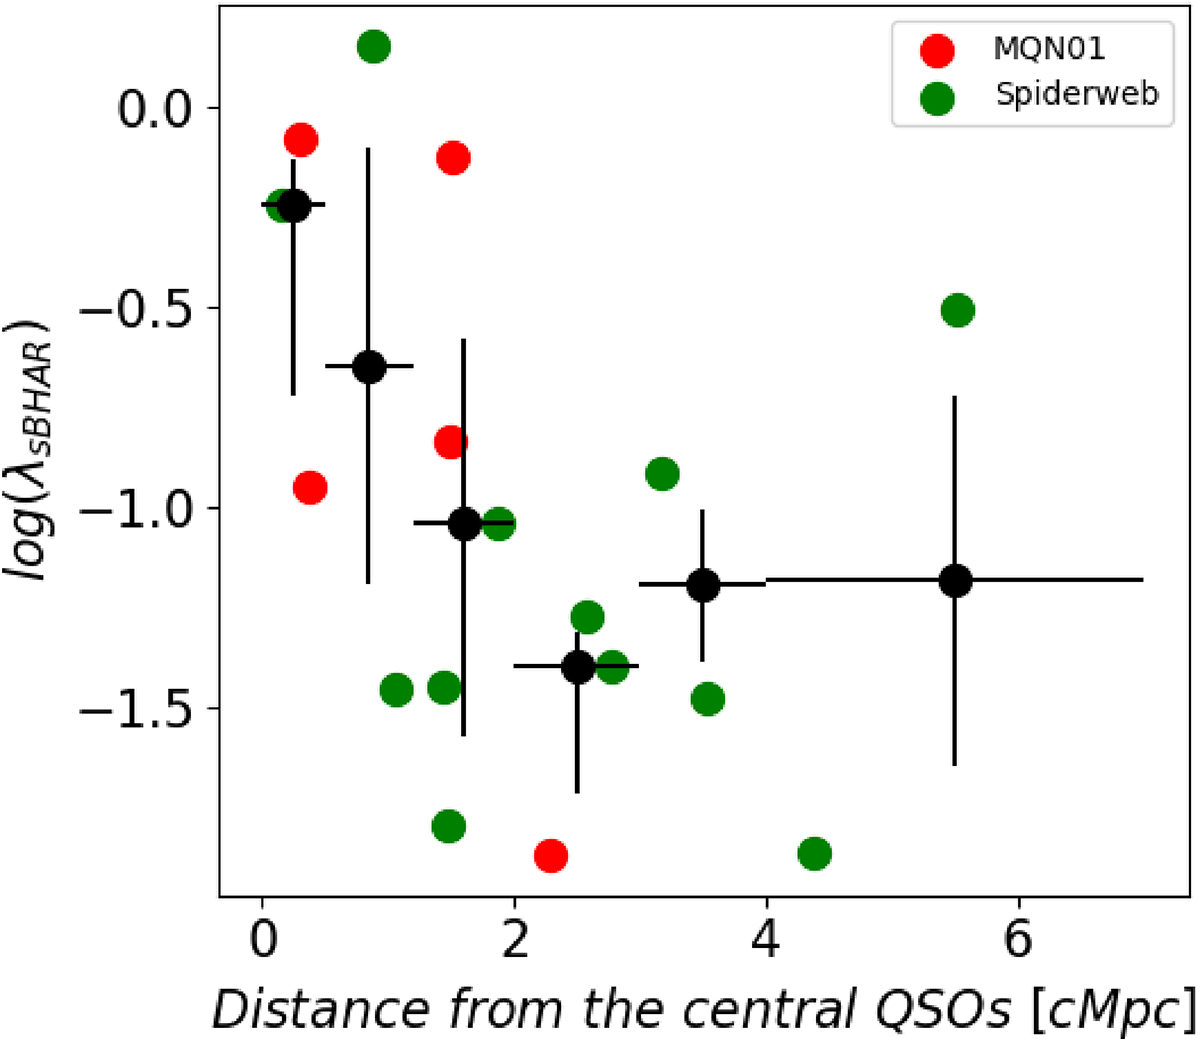
λsBHAR as a function of the distance from the central QSOs, CTS G18.01 in MQN01 (red) and PSK1138 in the Spiderweb (green) protocluster. The black dots mark the median values of λsBHAR for the AGN in both protoclusters across different bins of distance from the two central QSOs. The uncertainties correspond to the 16th and 84th percentile values within each radial bin.
Current usage metrics show cumulative count of Article Views (full-text article views including HTML views, PDF and ePub downloads, according to the available data) and Abstracts Views on Vision4Press platform.
Data correspond to usage on the plateform after 2015. The current usage metrics is available 48-96 hours after online publication and is updated daily on week days.
Initial download of the metrics may take a while.