Open Access
Fig. 7.
Download original image
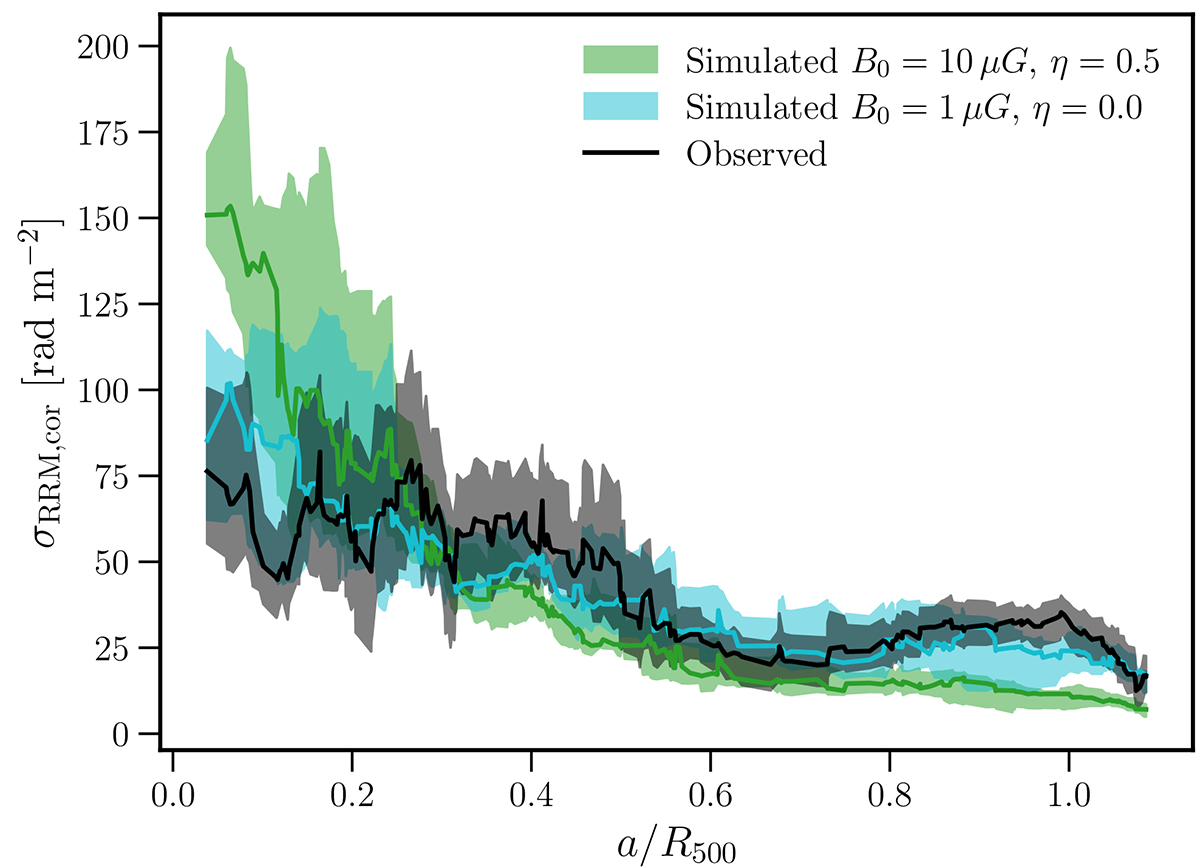
Corrected scatter of RRMs as a function of the projected distance to the nearest cluster centre for modelled clusters. The running scatter is calculated using a fixed sliding window of 50 points, with simulated profiles shown for η = 0.0 and η = 0.5.
Current usage metrics show cumulative count of Article Views (full-text article views including HTML views, PDF and ePub downloads, according to the available data) and Abstracts Views on Vision4Press platform.
Data correspond to usage on the plateform after 2015. The current usage metrics is available 48-96 hours after online publication and is updated daily on week days.
Initial download of the metrics may take a while.