Fig. 5.
Download original image
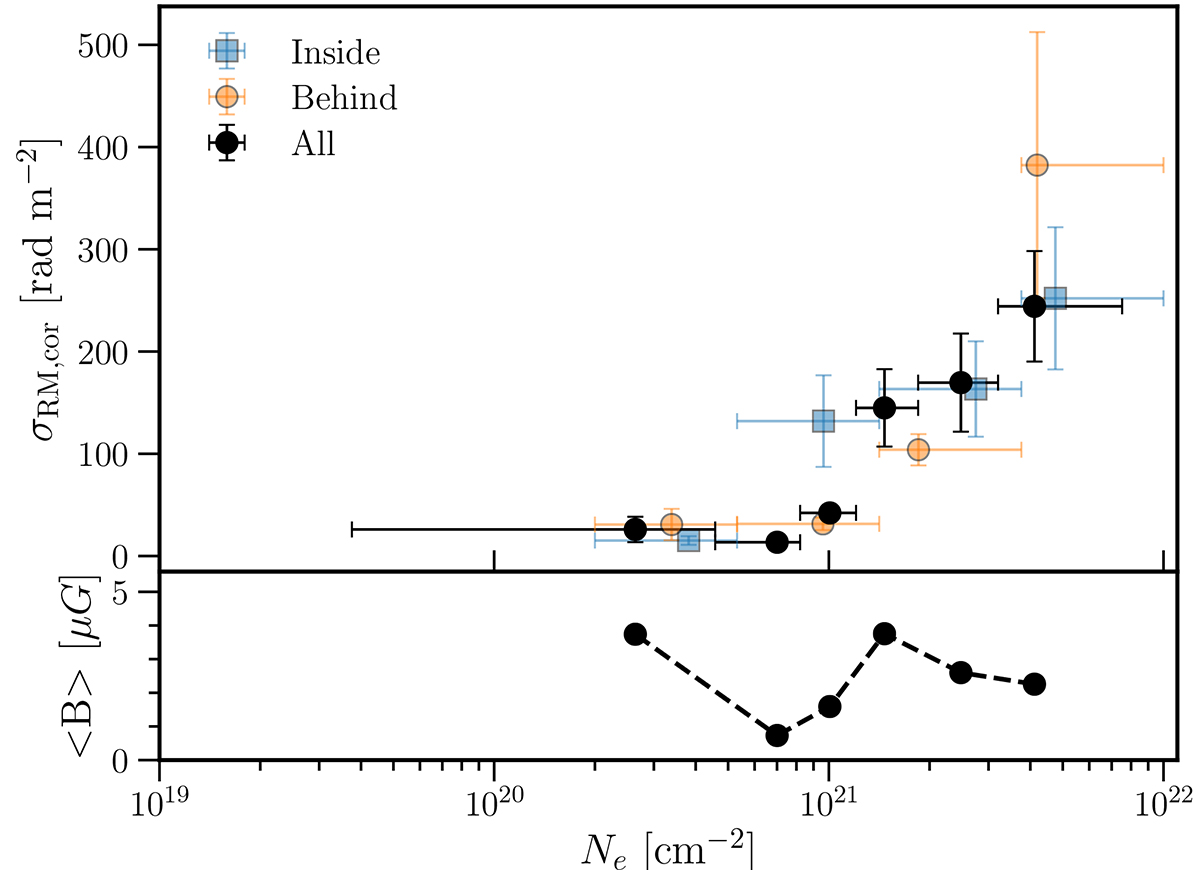
Corrected standard deviation of RMs in bins of electron column density, for sources detected at a < 2 R500. The bins for the full sample have equal frequency with 71 sources per bin, while the bins for the sub-samples are defined in logarithmically spaced bins to sample similar densities. The horizontal error bars indicate the bins, and points are plotted at the median Ne. The bottom panel shows the magnetic field estimate assuming Equation (12), with a correlation length that is a factor 100 smaller than the line-of-sight distance, resulting in a mean strength of ∼2 μG.
Current usage metrics show cumulative count of Article Views (full-text article views including HTML views, PDF and ePub downloads, according to the available data) and Abstracts Views on Vision4Press platform.
Data correspond to usage on the plateform after 2015. The current usage metrics is available 48-96 hours after online publication and is updated daily on week days.
Initial download of the metrics may take a while.