Open Access
Fig. B.2.
Download original image
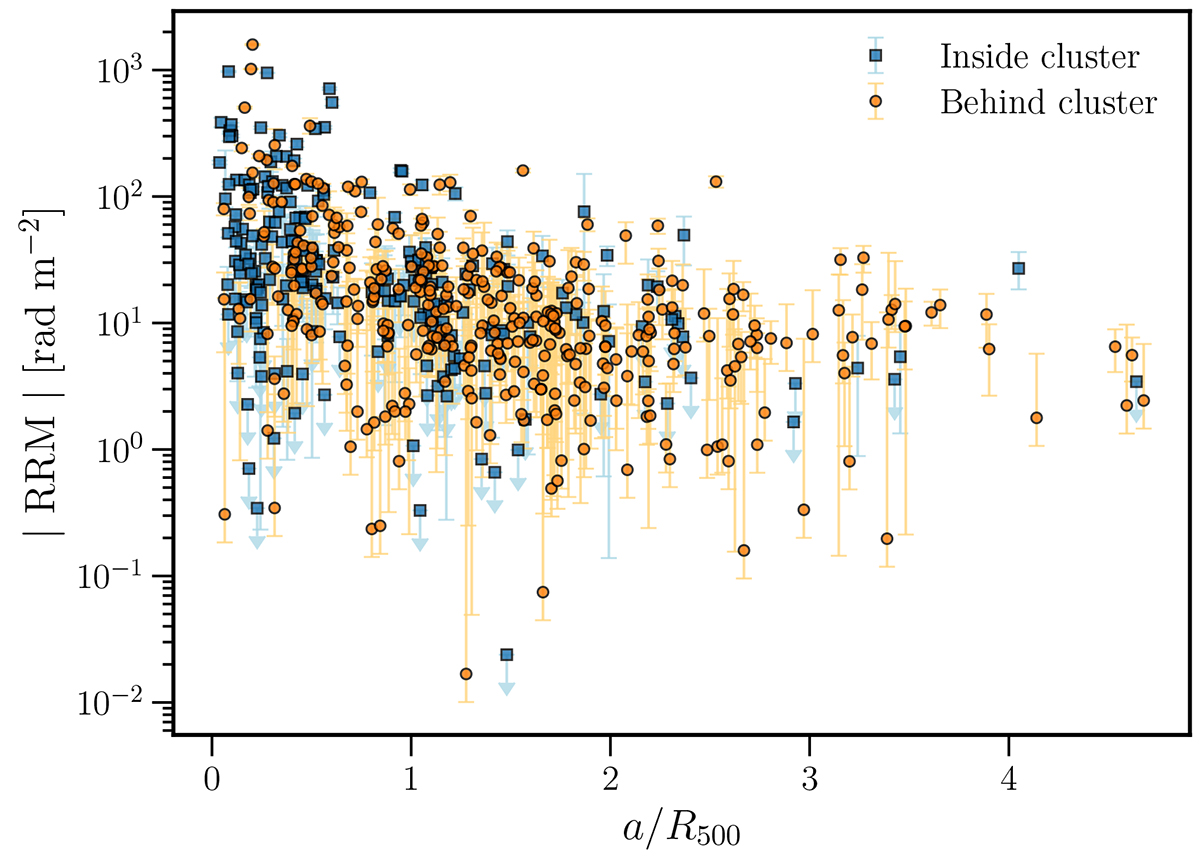
RRM as a function of the normalised distance to the nearest cluster centre. The y-axis is logarithmic for visualising low RM sources better than in Fig. 6. Uncertainties that are consistent with zero RM are plotted as downward-facing arrows.
Current usage metrics show cumulative count of Article Views (full-text article views including HTML views, PDF and ePub downloads, according to the available data) and Abstracts Views on Vision4Press platform.
Data correspond to usage on the plateform after 2015. The current usage metrics is available 48-96 hours after online publication and is updated daily on week days.
Initial download of the metrics may take a while.