Fig. A.1.
Download original image
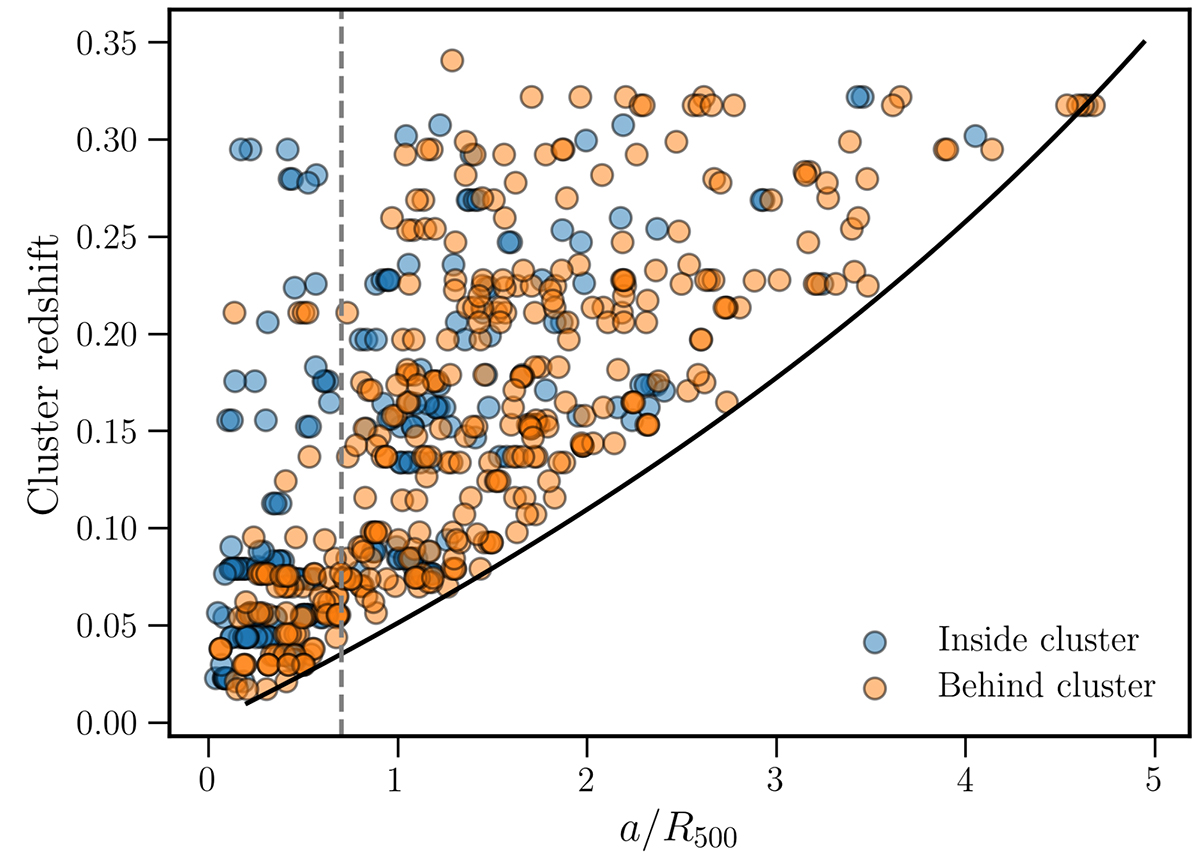
Distribution of all polarised radio sources in the (foreground) cluster versus projected radius plane. The black line shows the FWHM of the primary beam of the VLA L-band observations for a cluster of R500 = 900 kpc. The grey line shows the location where background sources start preferentially sampling higher redshift (higher mass) clusters, coinciding with the rising profile in Fig. 6.
Current usage metrics show cumulative count of Article Views (full-text article views including HTML views, PDF and ePub downloads, according to the available data) and Abstracts Views on Vision4Press platform.
Data correspond to usage on the plateform after 2015. The current usage metrics is available 48-96 hours after online publication and is updated daily on week days.
Initial download of the metrics may take a while.