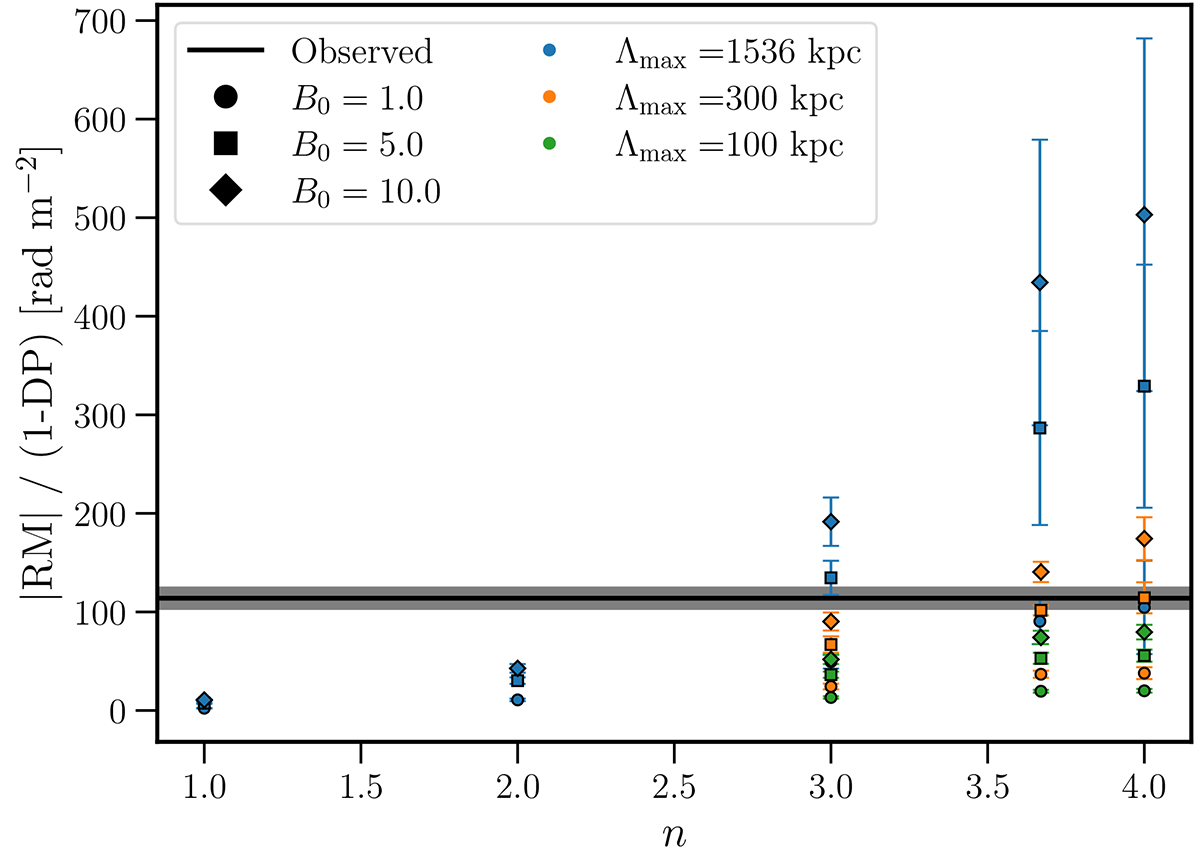
Fig. 10.
Download original image
RM ratio, as defined in Equation (13), as a function of the magnetic field power spectrum index n. The median observed value is indicated by the black line, while the simulated values are indicated by the coloured points, with different markers for different magnetic field strengths. The uncertainty on the simulated values reflect the 16th and 84th percentile of 10 random initialisations.
Current usage metrics show cumulative count of Article Views (full-text article views including HTML views, PDF and ePub downloads, according to the available data) and Abstracts Views on Vision4Press platform.
Data correspond to usage on the plateform after 2015. The current usage metrics is available 48-96 hours after online publication and is updated daily on week days.
Initial download of the metrics may take a while.