Fig. 8
Download original image
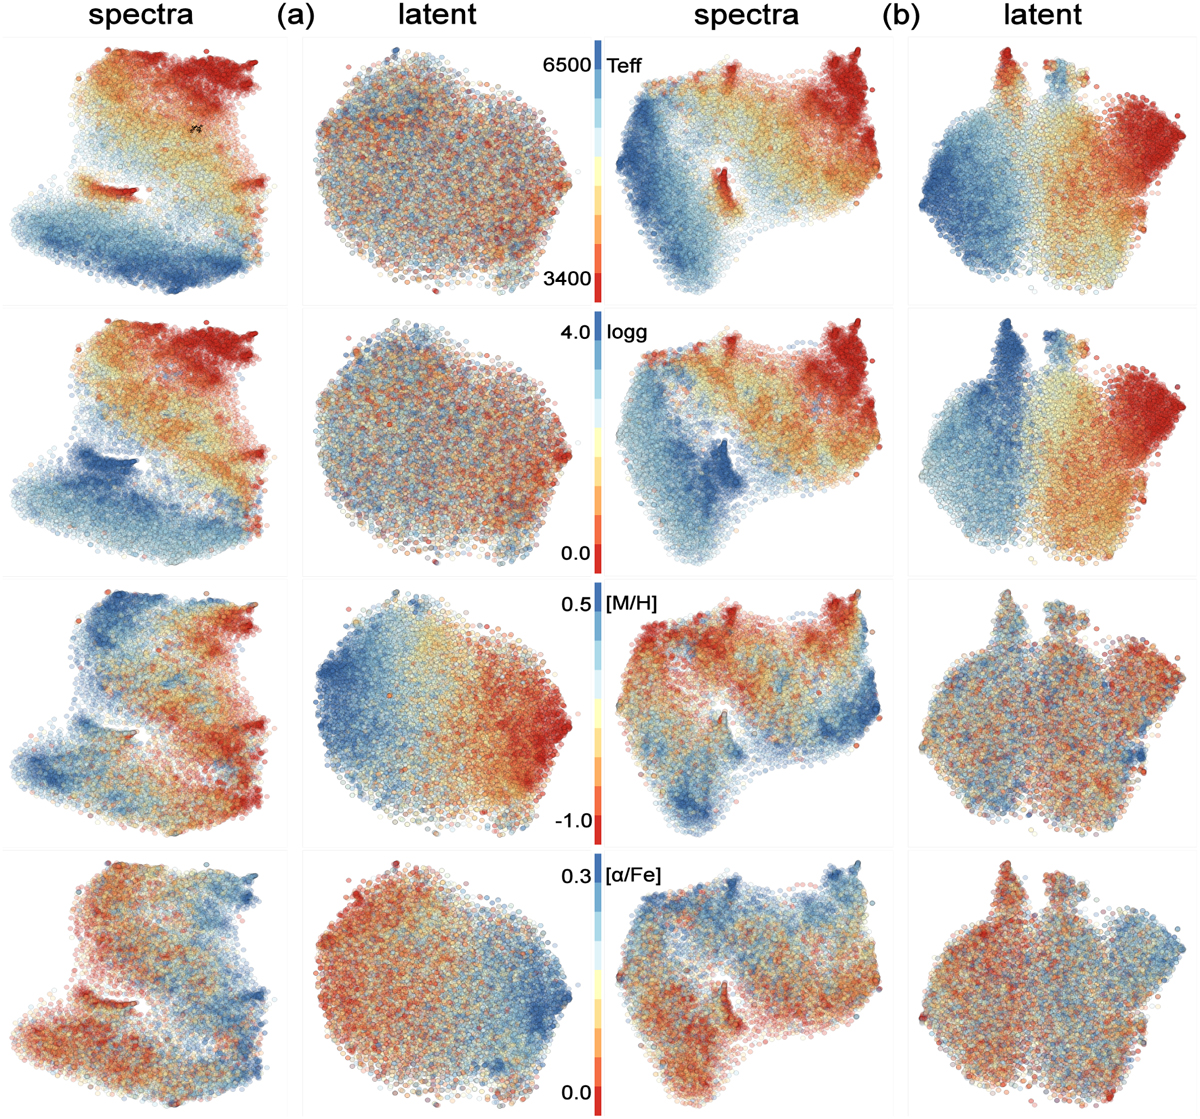
t-SNE diagram obtained for the two disentangling exercises. The column panels (a) refer to the first disentangling exercise, in which we tried to eliminate the contribution of the physical parameters (Teff and logɡ) in the latent space and reinforce the influence of the chemicals ones ([M/H] and [α/Fe]). The inverse case is shown in column (b). Each panel illustrates the t-SNE result on the original spectrum (sub-figures on the left) and the latent space (on the right) corresponding to each disentangling exercise. The figures are colour-coded according to the values of the parameters, as indicated in each figure.
Current usage metrics show cumulative count of Article Views (full-text article views including HTML views, PDF and ePub downloads, according to the available data) and Abstracts Views on Vision4Press platform.
Data correspond to usage on the plateform after 2015. The current usage metrics is available 48-96 hours after online publication and is updated daily on week days.
Initial download of the metrics may take a while.