Open Access
Fig. 9.
Download original image
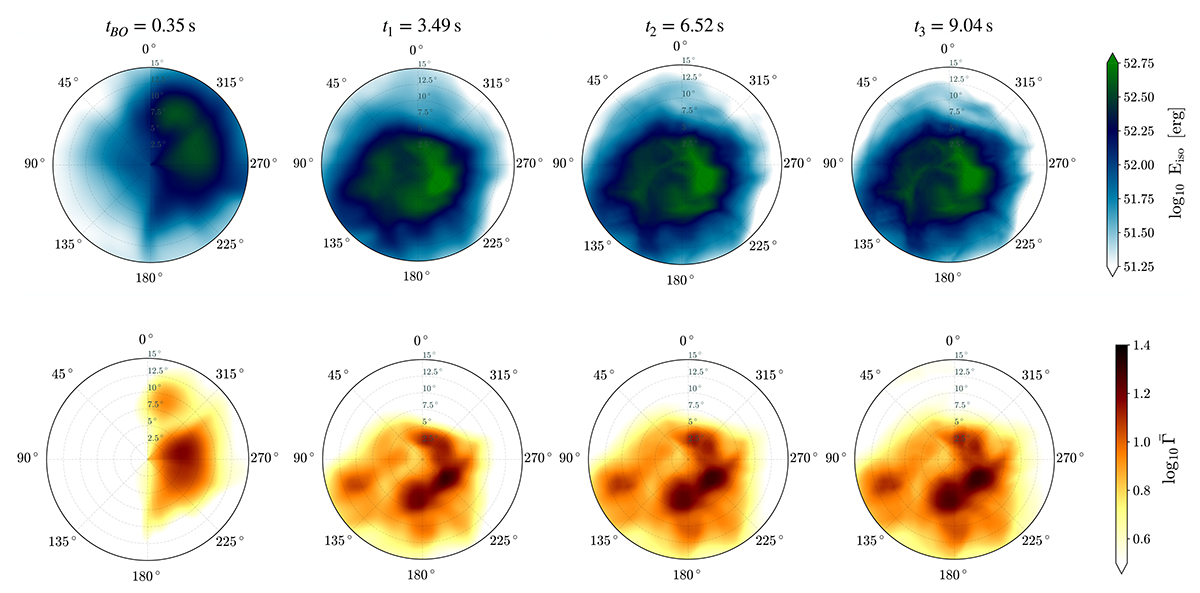
Two-dimensional angular distribution of the isotropic equivalent energy (top) and the radially averaged Lorentz factor (bottom) of the jet head at times tBO, t1, t2 and t3. The jet injection axis corresponds to the central point in each panel.
Current usage metrics show cumulative count of Article Views (full-text article views including HTML views, PDF and ePub downloads, according to the available data) and Abstracts Views on Vision4Press platform.
Data correspond to usage on the plateform after 2015. The current usage metrics is available 48-96 hours after online publication and is updated daily on week days.
Initial download of the metrics may take a while.