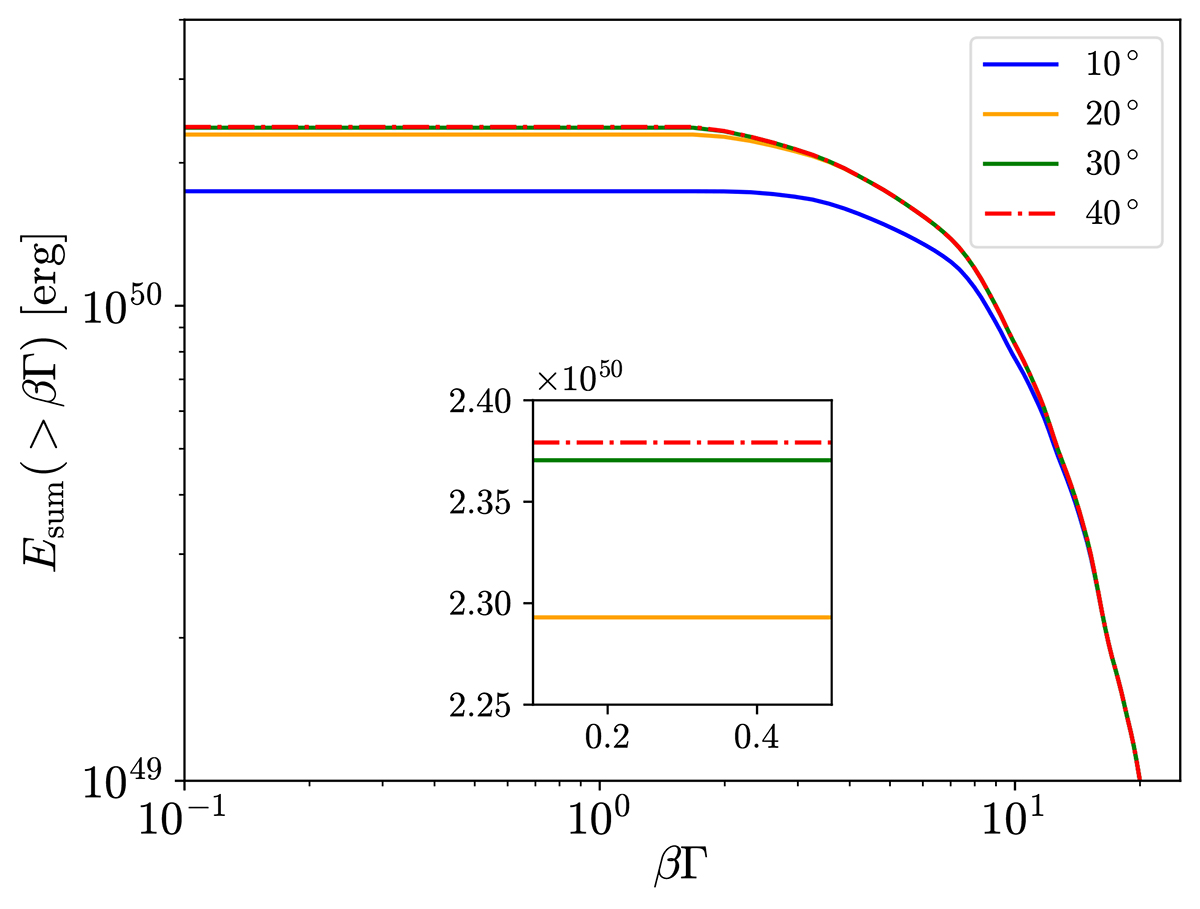
Fig. 8.
Download original image
Total energy Esum (without rest-mass energy contribution) of the fluid elements within the jet head having βΓ larger than a certain value, as a function of such a value. The different lines and colours correspond to the result obtained by limiting the calculation within 10°, 20°, 30°, and 40° from the jet injection axis. The plot refers to ≈9 s after the jet launching time. The inset shows a selected zoomed-in portion of the same profiles.
Current usage metrics show cumulative count of Article Views (full-text article views including HTML views, PDF and ePub downloads, according to the available data) and Abstracts Views on Vision4Press platform.
Data correspond to usage on the plateform after 2015. The current usage metrics is available 48-96 hours after online publication and is updated daily on week days.
Initial download of the metrics may take a while.