Fig. 6.
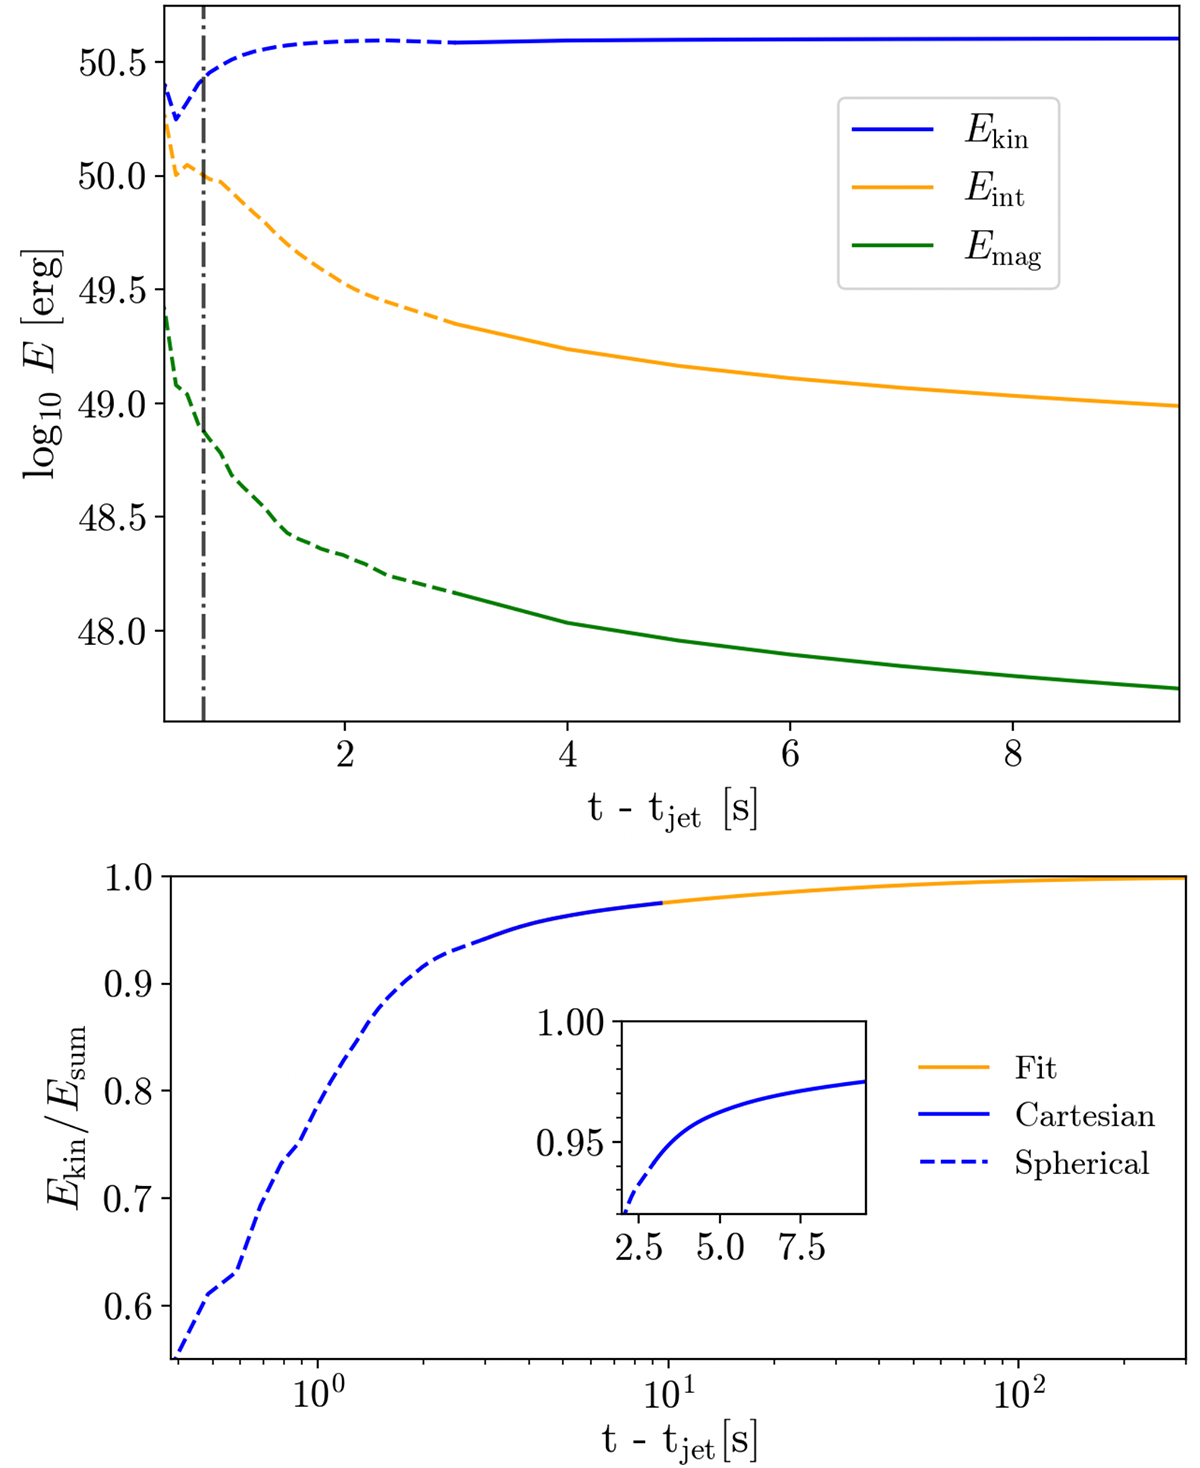
Download original image
Time evolution of the different energy components in the whole computational domain. Upper panel: kinetic (Ekin), internal (Eint), and magnetic (Emag) energies are represented, with dashed (continuous) lines referring to the evolution employing the spherical (Cartesian) grid. The black vertical line represents the breakout time (see text). Lower panel: Evolution of the fraction Ekin/Esum (see text) within the simulation time in the original spherical grid (dashed blue line) and after remapping into the new Cartesian grid (full blue line), further extrapolated to later times via a polynomial fit (orange line). Time is represented in logarithmic scale. In the inset, we show with a linear scale in time the behaviour of the same energy ratio referred only to the extended Cartesian simulation.
Current usage metrics show cumulative count of Article Views (full-text article views including HTML views, PDF and ePub downloads, according to the available data) and Abstracts Views on Vision4Press platform.
Data correspond to usage on the plateform after 2015. The current usage metrics is available 48-96 hours after online publication and is updated daily on week days.
Initial download of the metrics may take a while.