Fig. A.2.
Download original image
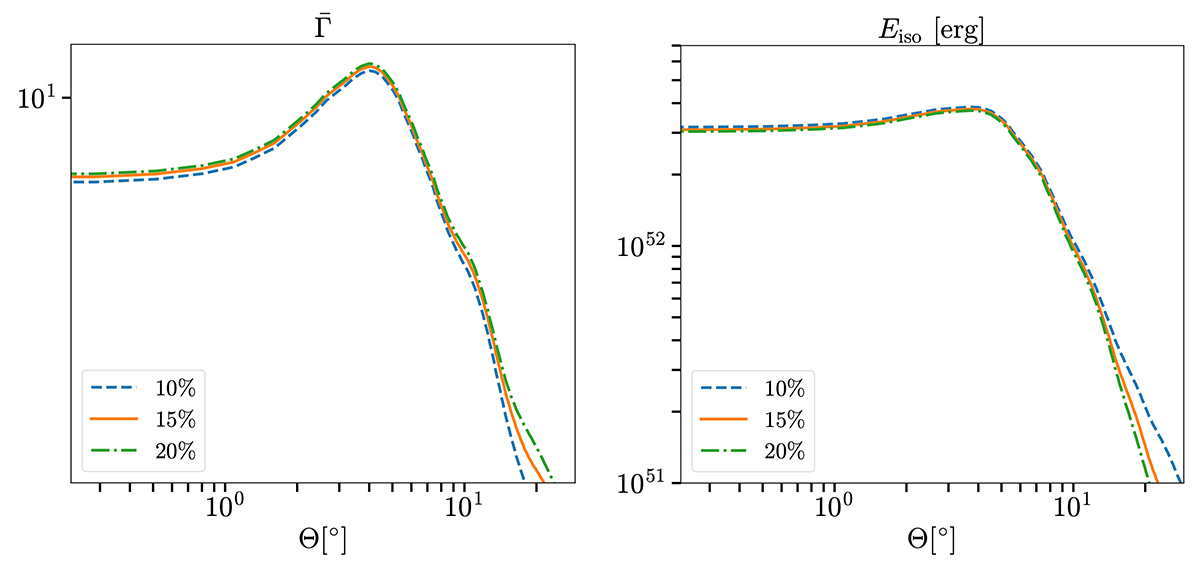
Φ-averaged profiles of the radially averaged Lorentz factor (top) and isotropic equivalent energy (bottom) of the jet head as functions of Θ at time t1, that is shortly after the beginning of our Cartesian simulation. The three profiles in each panel refer to the results obtained for different threshold fractions of the maximum dE/dt adopted to define the radial extension of the jet head (see Sect. 2.3), namely 10%, 15%, and 20%.
Current usage metrics show cumulative count of Article Views (full-text article views including HTML views, PDF and ePub downloads, according to the available data) and Abstracts Views on Vision4Press platform.
Data correspond to usage on the plateform after 2015. The current usage metrics is available 48-96 hours after online publication and is updated daily on week days.
Initial download of the metrics may take a while.