Fig. A.1.
Download original image
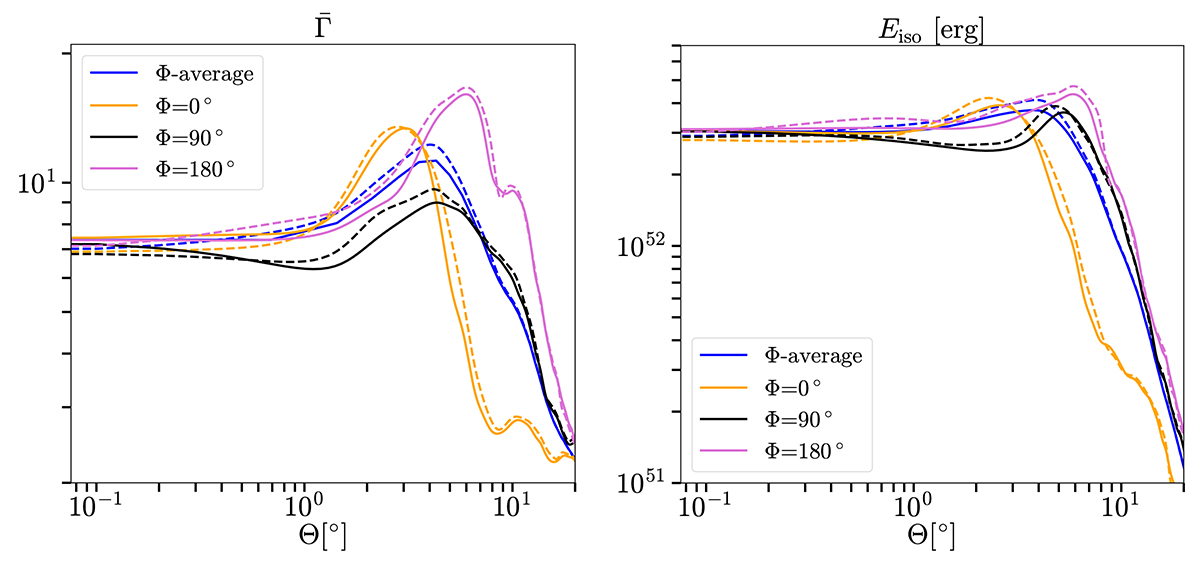
Radially averaged Lorentz factor (top) and isotropic equivalent energy (bottom) of the jet head (see Sect. 2.3) as functions of Θ, at t − tjet≃ 3 s. We compare the result for the original input data (dashed lines) with those obtained after a double spherical-to-Cartesian and Cartesian-to-spherical interpolation (continuous lines). We refer to the text for further details. Different colours refer to profiles for three different azimuthal angles Φ = 0° ,90° ,180° (in yellow, black, purple lines, respectively) and for the Φ-averaged result (blue line).
Current usage metrics show cumulative count of Article Views (full-text article views including HTML views, PDF and ePub downloads, according to the available data) and Abstracts Views on Vision4Press platform.
Data correspond to usage on the plateform after 2015. The current usage metrics is available 48-96 hours after online publication and is updated daily on week days.
Initial download of the metrics may take a while.