Open Access
Fig. 11.
Download original image
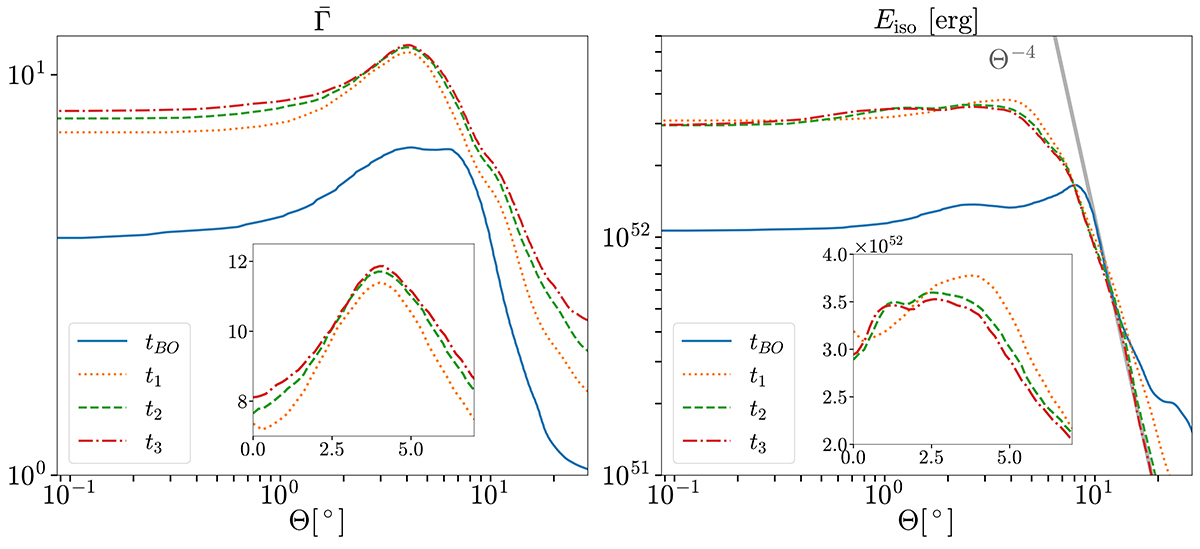
Φ-averaged profiles (see Fig. 10) of the radially averaged Lorentz factor (left) and isotropic equivalent energy (right) of the jet head as functions of Θ. In order to highlight how the angular distributions evolve with time, in each panel we plot together the result for four different times.
Current usage metrics show cumulative count of Article Views (full-text article views including HTML views, PDF and ePub downloads, according to the available data) and Abstracts Views on Vision4Press platform.
Data correspond to usage on the plateform after 2015. The current usage metrics is available 48-96 hours after online publication and is updated daily on week days.
Initial download of the metrics may take a while.