Fig. 5
Download original image
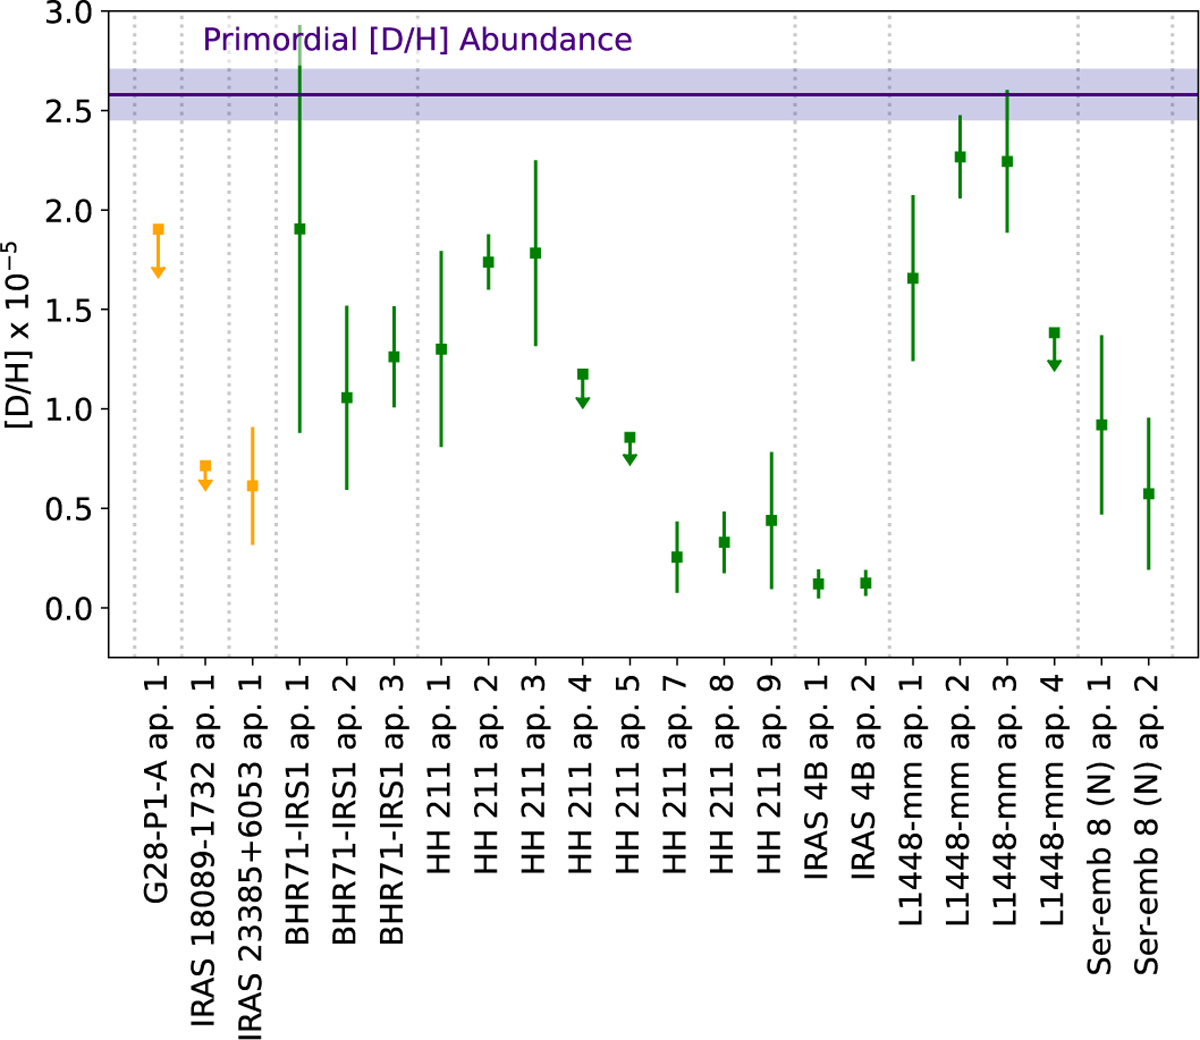
Comparison of [D/H] abundance (Table 2) in this work. A correction factor of 2.54 has been applied to our [D/H] measurements (see text). Orange symbols show [D/H] in apertures for high-mass sources, while green symbols show [D/H] in apertures from low-mass sources. The dotted gray lines separate different sources. The blue shaded region shows the primordial total [D/H] abundance of Cyburt et al. (2016). [D/H] upper limits above the primordial abundance are omitted.
Current usage metrics show cumulative count of Article Views (full-text article views including HTML views, PDF and ePub downloads, according to the available data) and Abstracts Views on Vision4Press platform.
Data correspond to usage on the plateform after 2015. The current usage metrics is available 48-96 hours after online publication and is updated daily on week days.
Initial download of the metrics may take a while.