Fig. 3
Download original image
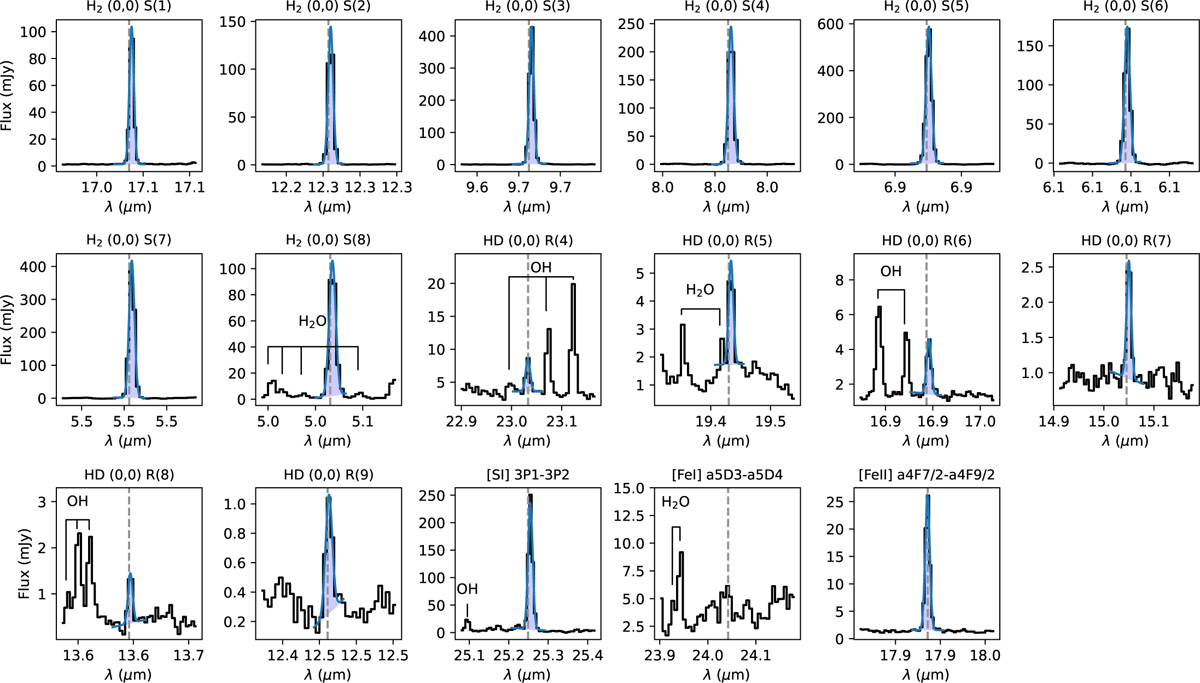
Spectral line fits for H2, HD, and the [S I], [Fe I], and [Fe II] atomic lines for HH 211 aperture 8. The line flux (shaded blue region) is determined by the simultaneous fit of a Gaussian profile and a first order polynomial to represent the continuum. the rest-frame wavelength of each spectral line is shown by a dashed gray line, and non-detections are shown without a shaded region for the fit. Nearby molecular lines of are labeled.
Current usage metrics show cumulative count of Article Views (full-text article views including HTML views, PDF and ePub downloads, according to the available data) and Abstracts Views on Vision4Press platform.
Data correspond to usage on the plateform after 2015. The current usage metrics is available 48-96 hours after online publication and is updated daily on week days.
Initial download of the metrics may take a while.