Fig. 1
Download original image
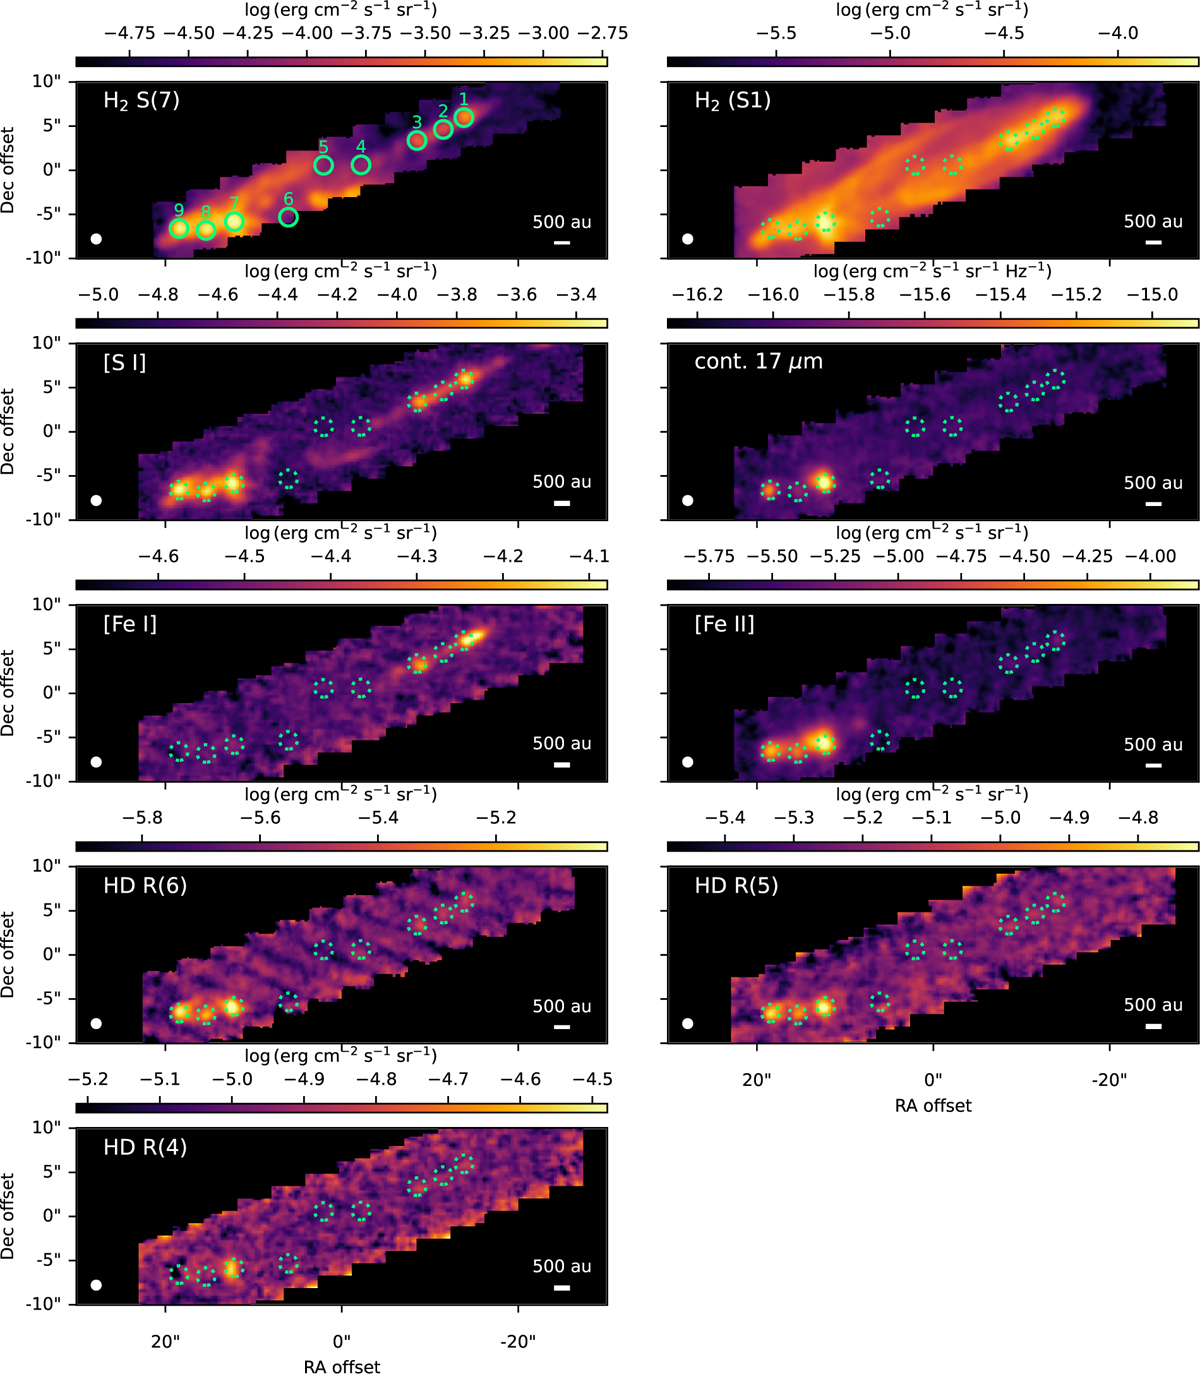
Integrated line intensity maps for HH 211 of various lines and the continuum at 17 µm shown with a logarithmic stretch. The maps have been smoothed to a common resolution of 1″, shown by the white circle in the bottom-left. Apertures used for spectral extraction are shown by the green circles. An index for each aperture is provided in the top-left panel. The coordinates of the aperture centers can be found in Table B.1 of Appendix B.
Current usage metrics show cumulative count of Article Views (full-text article views including HTML views, PDF and ePub downloads, according to the available data) and Abstracts Views on Vision4Press platform.
Data correspond to usage on the plateform after 2015. The current usage metrics is available 48-96 hours after online publication and is updated daily on week days.
Initial download of the metrics may take a while.