Fig. 5.
Download original image
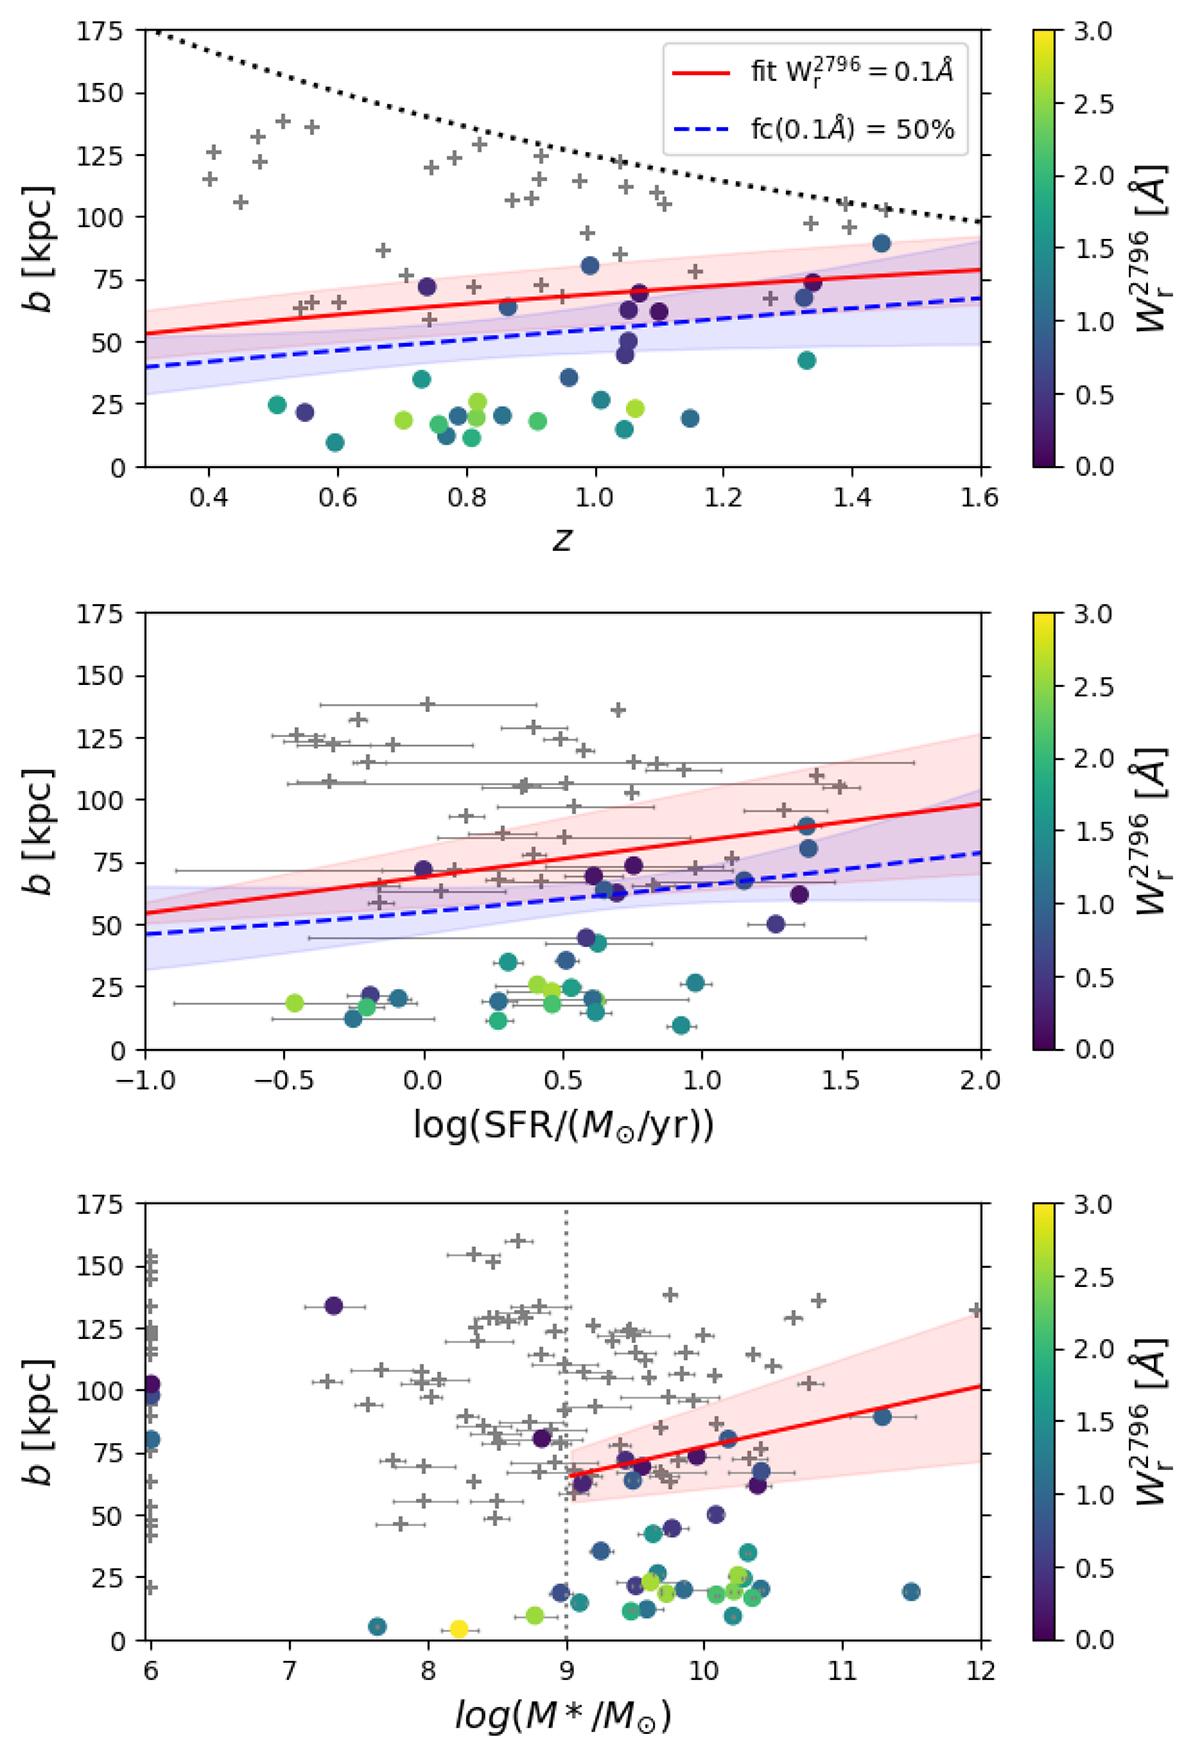
Dependence of Mg II absorption on galaxy redshift, SFR and stellar mass. The top and middle panels present the fitted dependence of Mg II absorption with z and log(SFR), respectively, for our isolated galaxy sample. The bottom panel shows how it converts in terms of M⋆ for the isolated galaxy sample extended to low mass galaxies (without the log(M⋆/M⊙) > 9 selection cut). In the top and middle panels, the solid red lines and the blue dashed lines represent, respectively, the impact parameter at which the ![]() reaches 0.1 Å and at which the 50% covering fraction reaches 0.1 Å according to the fits. The shaded areas represent 1-σ intervals. We take the other parameters constant with the values z = 1 and log(SFR/(M⊙ yr−1)) = 0. In the bottom panel, the red line is converted from the SFR relation using the main sequence from Boogaard et al. (2018). On all three panels, the associated Mg II absorption strength is color-coded for galaxies with
reaches 0.1 Å and at which the 50% covering fraction reaches 0.1 Å according to the fits. The shaded areas represent 1-σ intervals. We take the other parameters constant with the values z = 1 and log(SFR/(M⊙ yr−1)) = 0. In the bottom panel, the red line is converted from the SFR relation using the main sequence from Boogaard et al. (2018). On all three panels, the associated Mg II absorption strength is color-coded for galaxies with ![]() > 0.1 Å. Galaxies not associated with absorptions, or associated with absorptions with
> 0.1 Å. Galaxies not associated with absorptions, or associated with absorptions with ![]() < 0.1 Å, are represented by gray crosses. In the top panel, the black dotted line represents the redshift evolution of the virial radius for a halo of mass 1011.7Mh (used as our isolation distance). In the bottom panel, galaxies with no stellar mass estimation are represented at log(M⋆/M⊙) = 6.
< 0.1 Å, are represented by gray crosses. In the top panel, the black dotted line represents the redshift evolution of the virial radius for a halo of mass 1011.7Mh (used as our isolation distance). In the bottom panel, galaxies with no stellar mass estimation are represented at log(M⋆/M⊙) = 6.
Current usage metrics show cumulative count of Article Views (full-text article views including HTML views, PDF and ePub downloads, according to the available data) and Abstracts Views on Vision4Press platform.
Data correspond to usage on the plateform after 2015. The current usage metrics is available 48-96 hours after online publication and is updated daily on week days.
Initial download of the metrics may take a while.