Fig. 3.
Download original image
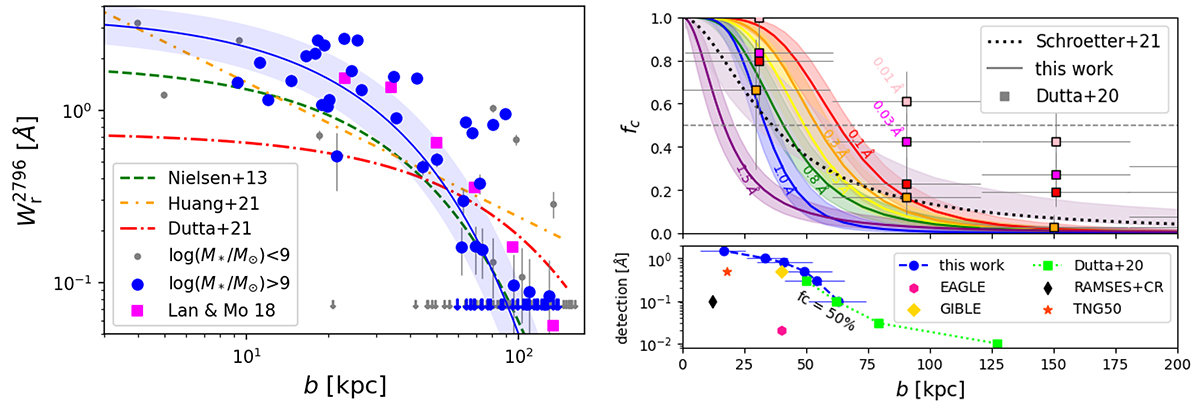
Mg II absorption profile around isolated galaxies. Left: ![]() -b relation for the sample of isolated galaxies. The blue dots represent our isolated galaxy sample and small gray dots represent log(M⋆/M⊙) < 9 isolated galaxies. The blue line is the
-b relation for the sample of isolated galaxies. The blue dots represent our isolated galaxy sample and small gray dots represent log(M⋆/M⊙) < 9 isolated galaxies. The blue line is the ![]() -b fit for log(M⋆/M⊙) > 9 isolated galaxies and the shaded area shows the 1-σ interval.
-b fit for log(M⋆/M⊙) > 9 isolated galaxies and the shaded area shows the 1-σ interval. ![]() -b fits from Dutta et al. (2020), Nielsen et al. (2013a) and Huang et al. (2021) are also represented, along with the binned values from Lan & Mo (2018). Right: Mg II covering fraction as a function of impact parameter for the 66 log(M⋆/M⊙) > 9 isolated galaxies for different Wt thresholds. The shaded areas are 1-σ uncertainties. The dotted line represents the covering fraction computed by Schroetter et al. (2021) for MEGAFLOW for a 0.1 Å detection limit for primary galaxies (no mass selection). The squares represent the differential covering fraction from Dutta et al. (2020) for different Wt thresholds. The lower panel shows the impact parameter, b, corresponding to the 50% covering fraction as a function of the Wt threshold value for our sample (dashed blue line) and interpolated from the covering fraction values from Dutta et al. (2020) (dotted green line). We also show the b50 from DeFelippis et al. (2021) (TNG50), DeFelippis et al. (2024) (RAMSES with cosmic rays), Ho et al. (2020) (EAGLE), and Ramesh & Nelson (2024) (GIBLE at z = 1).
-b fits from Dutta et al. (2020), Nielsen et al. (2013a) and Huang et al. (2021) are also represented, along with the binned values from Lan & Mo (2018). Right: Mg II covering fraction as a function of impact parameter for the 66 log(M⋆/M⊙) > 9 isolated galaxies for different Wt thresholds. The shaded areas are 1-σ uncertainties. The dotted line represents the covering fraction computed by Schroetter et al. (2021) for MEGAFLOW for a 0.1 Å detection limit for primary galaxies (no mass selection). The squares represent the differential covering fraction from Dutta et al. (2020) for different Wt thresholds. The lower panel shows the impact parameter, b, corresponding to the 50% covering fraction as a function of the Wt threshold value for our sample (dashed blue line) and interpolated from the covering fraction values from Dutta et al. (2020) (dotted green line). We also show the b50 from DeFelippis et al. (2021) (TNG50), DeFelippis et al. (2024) (RAMSES with cosmic rays), Ho et al. (2020) (EAGLE), and Ramesh & Nelson (2024) (GIBLE at z = 1).
Current usage metrics show cumulative count of Article Views (full-text article views including HTML views, PDF and ePub downloads, according to the available data) and Abstracts Views on Vision4Press platform.
Data correspond to usage on the plateform after 2015. The current usage metrics is available 48-96 hours after online publication and is updated daily on week days.
Initial download of the metrics may take a while.