Fig. 1.
Download original image
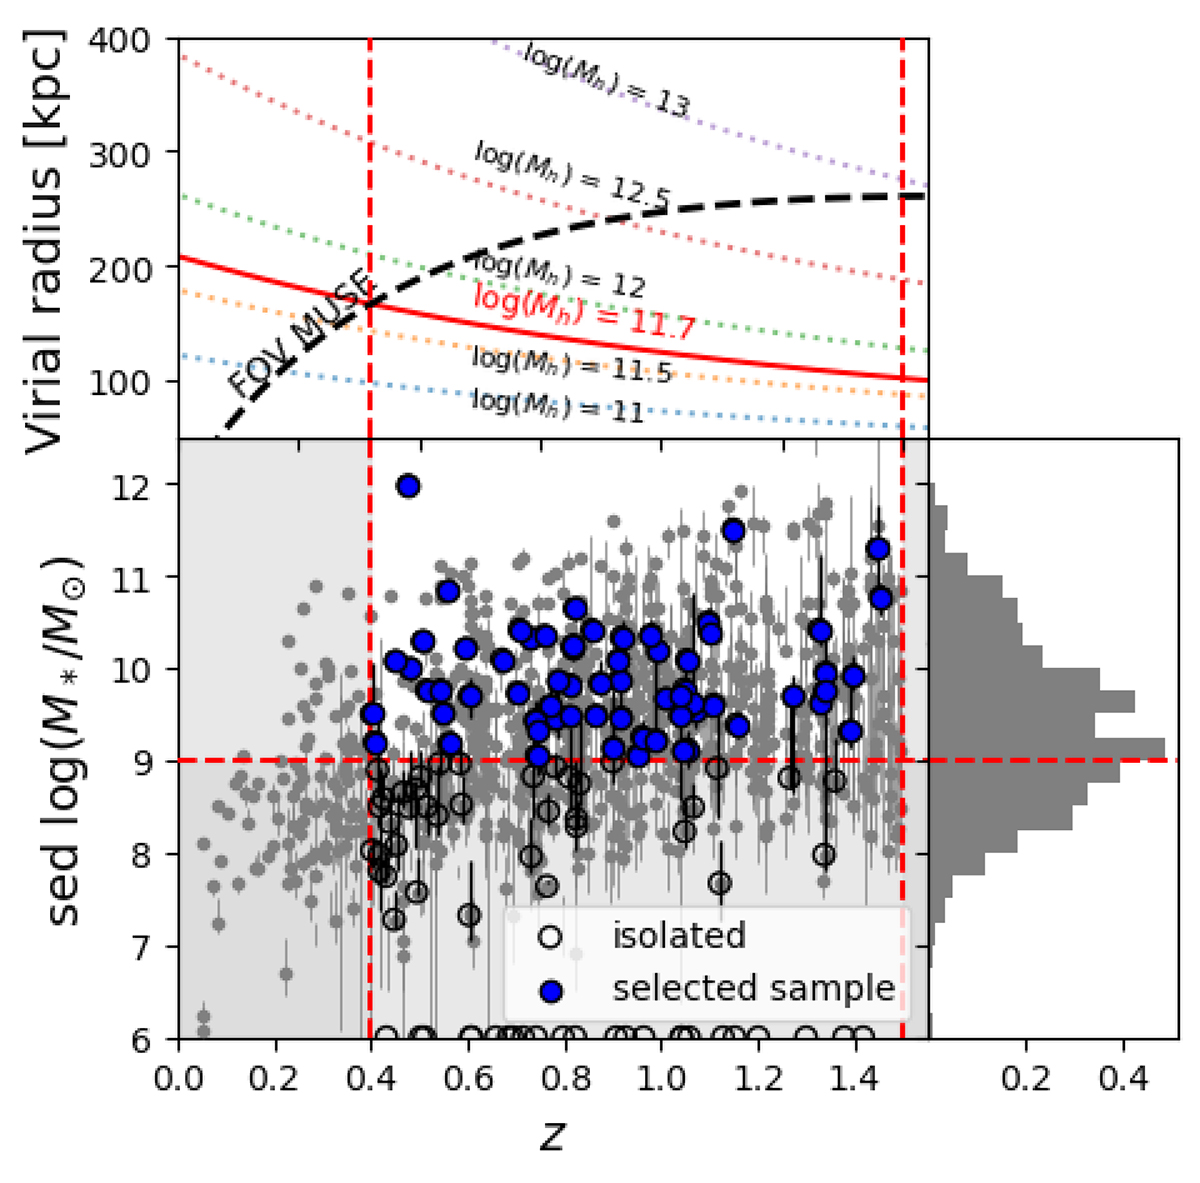
Selection of the isolated galaxy sample. Top: Evolution of the virial radius with redshift for different halo masses compared to the evolution of the size of the MUSE field of view. The solid red line represents the virial radius for the median halo mass of our sample (that we chose as our isolation radius). The vertical dashed lines indicate our redshift selection (0.4 < z < 1.5) for which the isolation radius is contained within the MUSE field of view. Bottom: Distribution of the stellar masses for MEGAFLOW galaxies at z < 1.5. We consider the MEGAFLOW survey reasonably complete for 0.4 < z < 1.5 down to log(M⋆/M⊙) = 9 (represented by the horizontal dashed line). Our volume-limited sample of isolated galaxies is represented by the blue dots.
Current usage metrics show cumulative count of Article Views (full-text article views including HTML views, PDF and ePub downloads, according to the available data) and Abstracts Views on Vision4Press platform.
Data correspond to usage on the plateform after 2015. The current usage metrics is available 48-96 hours after online publication and is updated daily on week days.
Initial download of the metrics may take a while.