Fig. 8.
Download original image
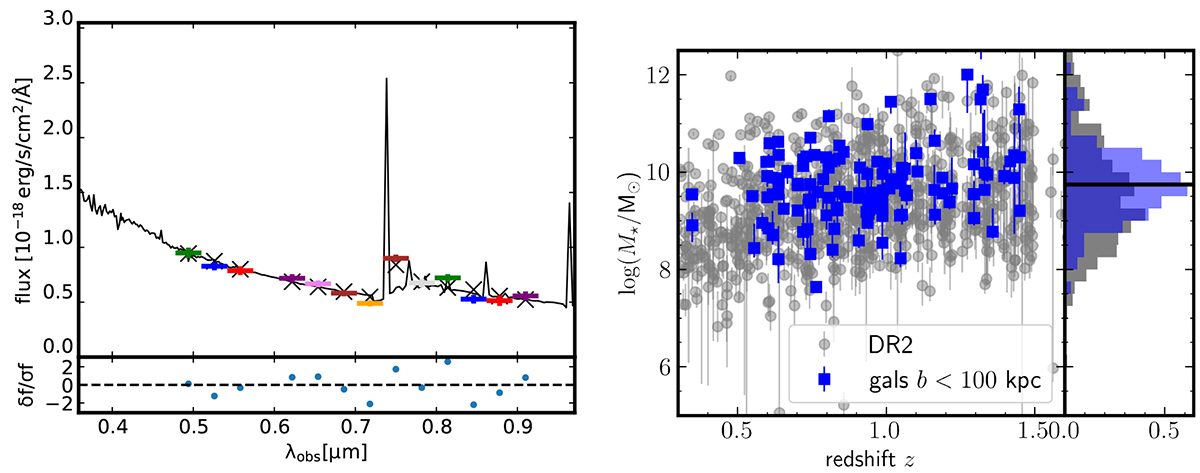
Stellar mass estimations. Left: Spectral energy distribution (SED) for galaxy ID = 22 055 at z = 0.9856 from field J1039p0714. The black line represents the best fit template. The solid bars represent the pseudo-narrow bands. Right: Stellar-mass vs redshift for the galaxies in the DR2 catalogue at 0.35 < z < 1.5. The squares represent the galaxies within 500 km s−1 of the Mg II absorbers and with impact parameters b < 100 kpc. The histogram shows the normalised stellar mass distributions.
Current usage metrics show cumulative count of Article Views (full-text article views including HTML views, PDF and ePub downloads, according to the available data) and Abstracts Views on Vision4Press platform.
Data correspond to usage on the plateform after 2015. The current usage metrics is available 48-96 hours after online publication and is updated daily on week days.
Initial download of the metrics may take a while.