Fig. 4.
Download original image
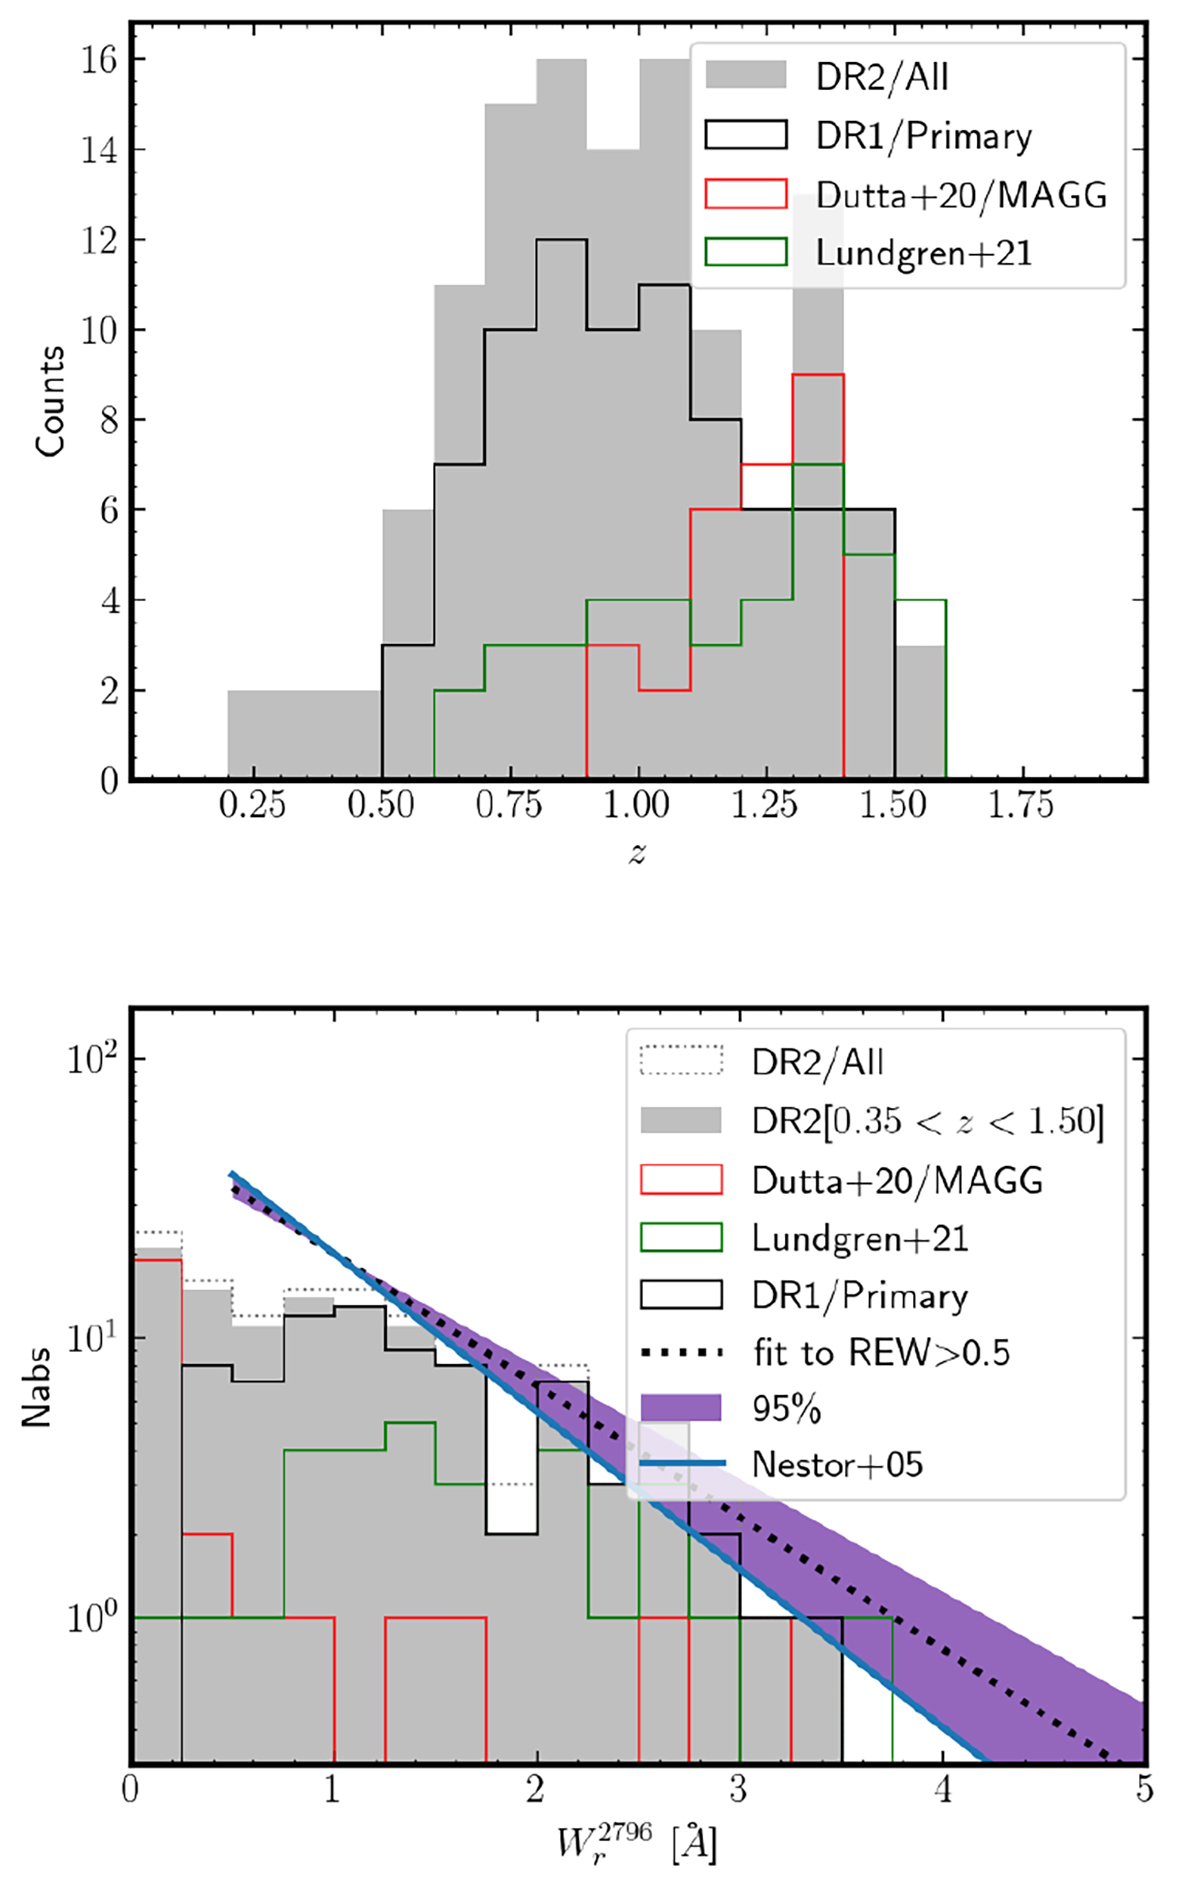
Properties of the Mg II absorption catalogue. Top: Redshift distribution of the Mg II absorption systems. The solid and gray histograms show the absorbers for the SDSS (DR1) and UVES (DR2) selections, respectively. Bottom: Rest-frame equivalent width ![]() distribution of the Mg II absorption systems. The dashed histogram shows the full sample of DR2 absorbers, while the solid and gray histograms represent the absorbers for the SDSS (DR1) and UVES (DR2) samples, respectively, over the same redshift interval 0.35 < z < 1.5. In order to compare the slope of the
distribution of the Mg II absorption systems. The dashed histogram shows the full sample of DR2 absorbers, while the solid and gray histograms represent the absorbers for the SDSS (DR1) and UVES (DR2) samples, respectively, over the same redshift interval 0.35 < z < 1.5. In order to compare the slope of the ![]() distribution to random QSO field, we show the REW distribution from Nestor et al. (2005) (solid line) at z = 1 (arbitrary normalisation). For
distribution to random QSO field, we show the REW distribution from Nestor et al. (2005) (solid line) at z = 1 (arbitrary normalisation). For ![]() Å, the 95% confidence interval of the REW slope is shown (tied to
Å, the 95% confidence interval of the REW slope is shown (tied to ![]() Å). The Mg II REW distribution in MEGAFLOW is not different than from random QSOs for strong Mg II absorptions. In both panels, the red (green) histogram represents the Mg II sample from Dutta et al. (2020), Lundgren et al. (2021), respectively.
Å). The Mg II REW distribution in MEGAFLOW is not different than from random QSOs for strong Mg II absorptions. In both panels, the red (green) histogram represents the Mg II sample from Dutta et al. (2020), Lundgren et al. (2021), respectively.
Current usage metrics show cumulative count of Article Views (full-text article views including HTML views, PDF and ePub downloads, according to the available data) and Abstracts Views on Vision4Press platform.
Data correspond to usage on the plateform after 2015. The current usage metrics is available 48-96 hours after online publication and is updated daily on week days.
Initial download of the metrics may take a while.