Fig. 12.
Download original image
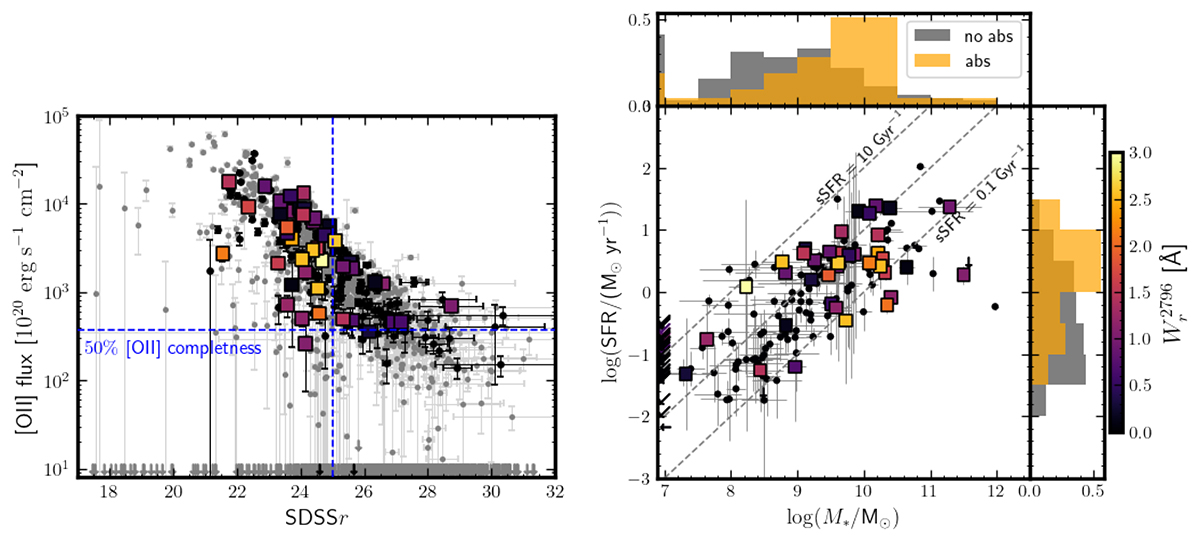
Star formation rates. Left: Measured [O II] flux versus SDSS r magnitude recomputed with PHOTUTILS. The full MEGAFLOW sample is represented with gray dots. Colored and black dots represent, respectively, the primary galaxies that are associated and not associated with a counterpart absorption. Galaxies with no detected [O II] flux are represented by downward arrows. Right: Estimated stellar mass versus estimated SFR for the primary galaxies. The top and right histograms present respectively the stellar mass distribution and the SFR distribution for the galaxies associated (orange) and not associated (gray) with a Mg II absorption. Arrows on the left indicates galaxies without stellar mass estimation and/or no SFR estimation (because no [O II] emission detected). The primary galaxies associated with an absorption are colored according to the Mg II absorption rest-frame equivalent width. Error bars are 1σ uncertainties.
Current usage metrics show cumulative count of Article Views (full-text article views including HTML views, PDF and ePub downloads, according to the available data) and Abstracts Views on Vision4Press platform.
Data correspond to usage on the plateform after 2015. The current usage metrics is available 48-96 hours after online publication and is updated daily on week days.
Initial download of the metrics may take a while.