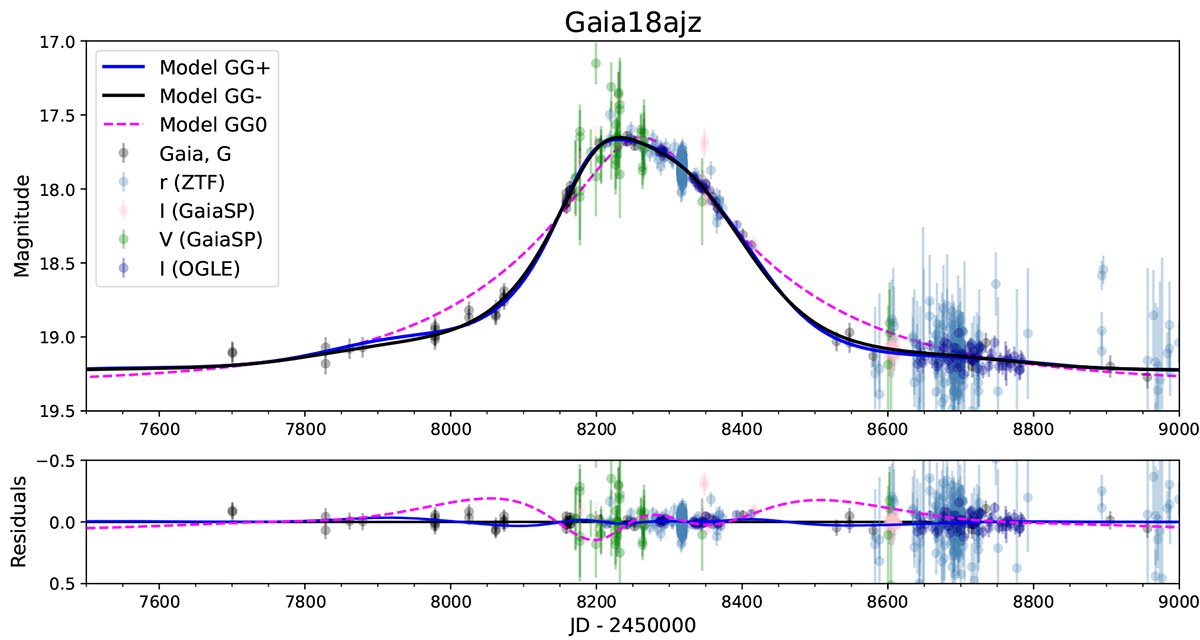
Fig. 4.
Download original image
Light curve of the Gaia18azj event and the microlensing model fit using the Gaia data as well as the ground-based survey data from ZTF, SMARTS, and OGLE. The dashed magenta line represents the model without parallax, while the blue and black solid lines show the positive and negative solutions for the parallax model, respectively. The bottom panel shows the residuals with respect to the negative solution for the parallax model.
Current usage metrics show cumulative count of Article Views (full-text article views including HTML views, PDF and ePub downloads, according to the available data) and Abstracts Views on Vision4Press platform.
Data correspond to usage on the plateform after 2015. The current usage metrics is available 48-96 hours after online publication and is updated daily on week days.
Initial download of the metrics may take a while.