Fig. 3
Download original image
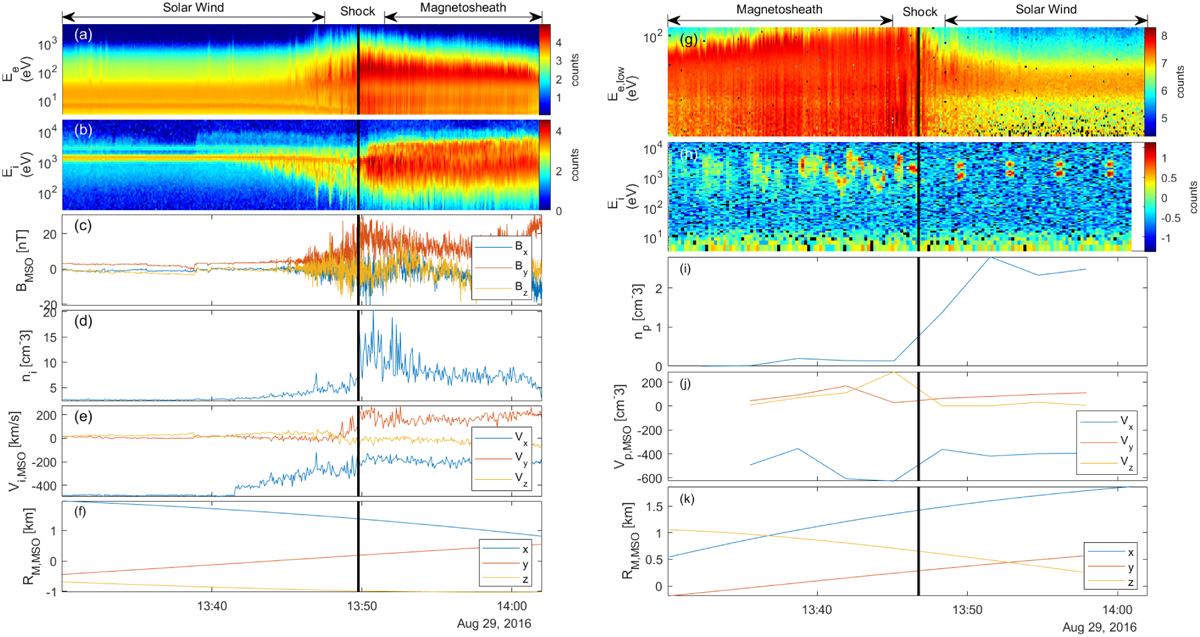
Data from an example event where MAVEN and MEX crossed the bow shock within 10 minutes of each other. The left side shows MAVEN data, and the panels show (a) the electron energy spectrogram, (b) the ion energy spectrogram, (c) the magnetic field, (d) the ion density, (e) the ion bulk velocity, and (f) the spacecraft position. The right plot shows MEX data, and the panels show (g) the electron energy spectrogram, (h) the ion energy spectrogram, (i) the proton density, (j) the proton velocity, and (k) the spacecraft position. The arrows above the two figures indicate the regions through which the spacecraft traveled. The vertical black line shows the manually chosen bow shock crossing. All data are given in the MSO coordinate system.
Current usage metrics show cumulative count of Article Views (full-text article views including HTML views, PDF and ePub downloads, according to the available data) and Abstracts Views on Vision4Press platform.
Data correspond to usage on the plateform after 2015. The current usage metrics is available 48-96 hours after online publication and is updated daily on week days.
Initial download of the metrics may take a while.