Fig. 17.
Download original image
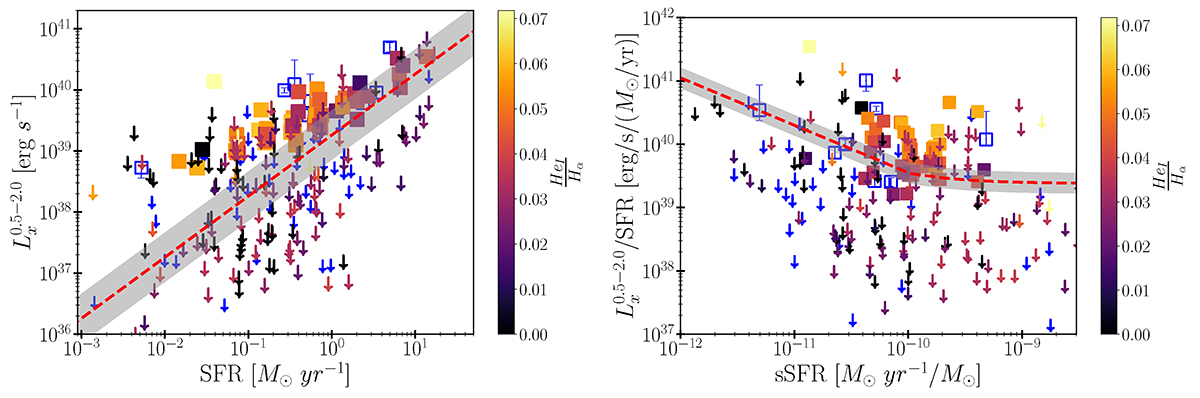
Distribution of the ![]() as a function of the SFR, sSFR, and the He I/H α age indicator. The left panel shows the distribution of the SFR-M⋆-D stacks in the
as a function of the SFR, sSFR, and the He I/H α age indicator. The left panel shows the distribution of the SFR-M⋆-D stacks in the ![]() -SFR plane colour-coded with the He I/H α ratio. Red line depicts the standard scaling relation from Mineo et al. (2014) (M14). The right panel shows the same distribution in the
-SFR plane colour-coded with the He I/H α ratio. Red line depicts the standard scaling relation from Mineo et al. (2014) (M14). The right panel shows the same distribution in the ![]() – sSFR plane and the red line the scaling relation from Lehmer et al. (2016) (L16).
– sSFR plane and the red line the scaling relation from Lehmer et al. (2016) (L16).
Current usage metrics show cumulative count of Article Views (full-text article views including HTML views, PDF and ePub downloads, according to the available data) and Abstracts Views on Vision4Press platform.
Data correspond to usage on the plateform after 2015. The current usage metrics is available 48-96 hours after online publication and is updated daily on week days.
Initial download of the metrics may take a while.