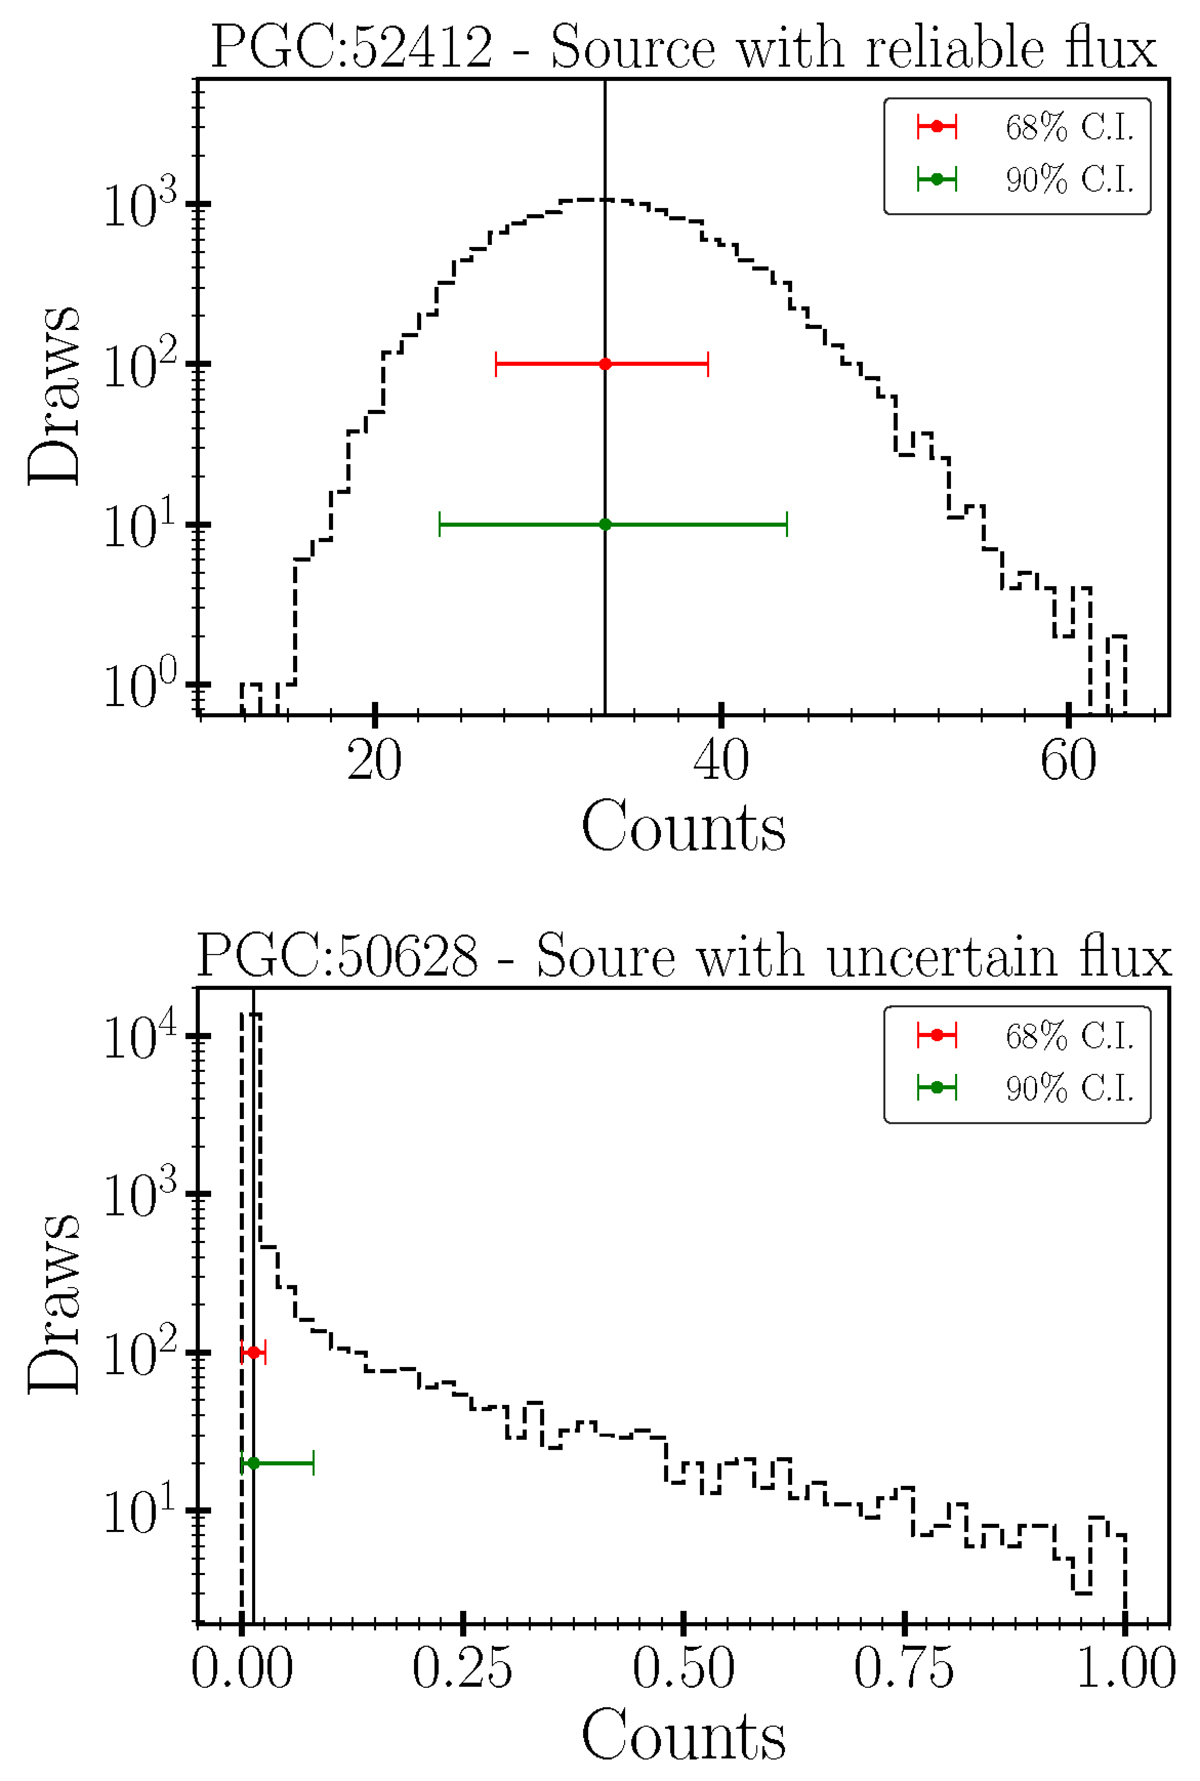
Fig. 1.
Download original image
Example of the posterior count distribution of two sources in our sample for which we have reliable and unreliable flux measurement as defined based on the Eq. (1). The red and green error bars indicate the upper and lower bounds of the distribution at the 68% and the 90% C.I., respectively. The vertical black solid line indicates the mode value.
Current usage metrics show cumulative count of Article Views (full-text article views including HTML views, PDF and ePub downloads, according to the available data) and Abstracts Views on Vision4Press platform.
Data correspond to usage on the plateform after 2015. The current usage metrics is available 48-96 hours after online publication and is updated daily on week days.
Initial download of the metrics may take a while.