Open Access
Fig. A.4.
Download original image
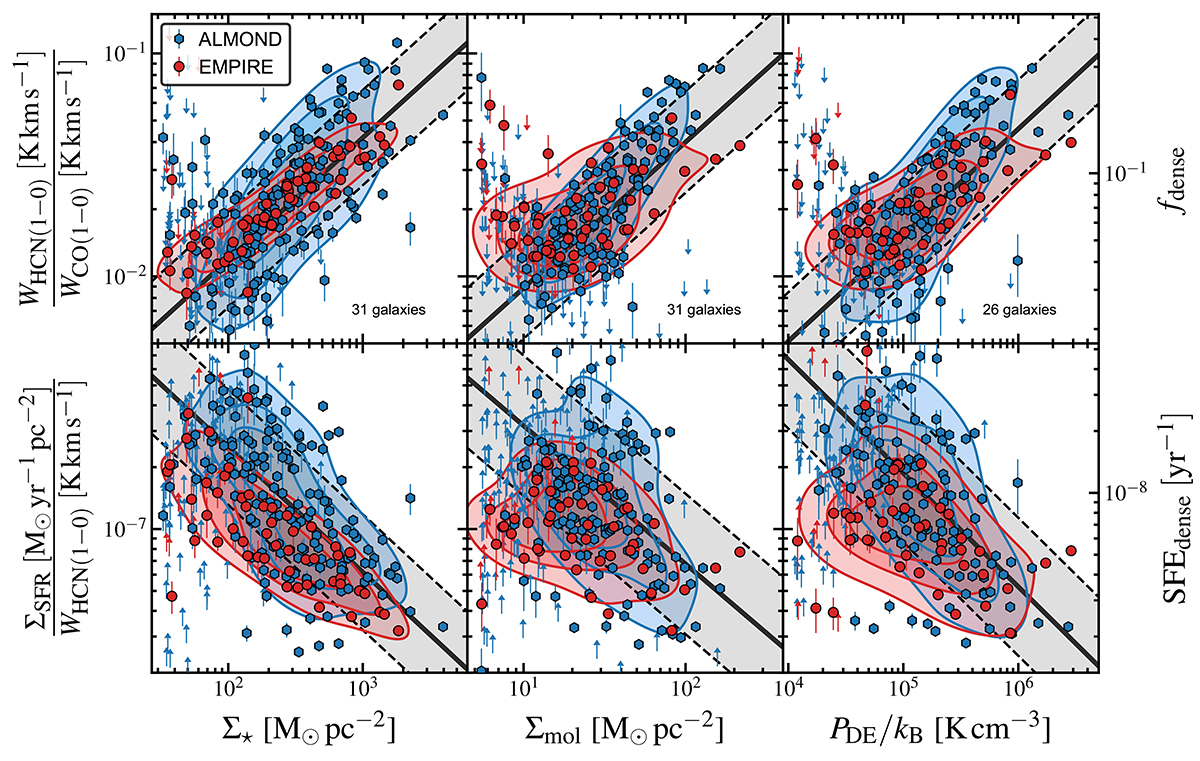
Similar to Fig. 3, but separately showing kiloparsec-scale, stacked measurements from ALMOND (blue hexagons) and EMPIRE (red circles). The best-fit line (solid black line) and the corresponding 1-sigma scatter (grey-shaded area) are computed from the combined data using LinMix.
Current usage metrics show cumulative count of Article Views (full-text article views including HTML views, PDF and ePub downloads, according to the available data) and Abstracts Views on Vision4Press platform.
Data correspond to usage on the plateform after 2015. The current usage metrics is available 48-96 hours after online publication and is updated daily on week days.
Initial download of the metrics may take a while.