Open Access
Fig. A.2.
Download original image
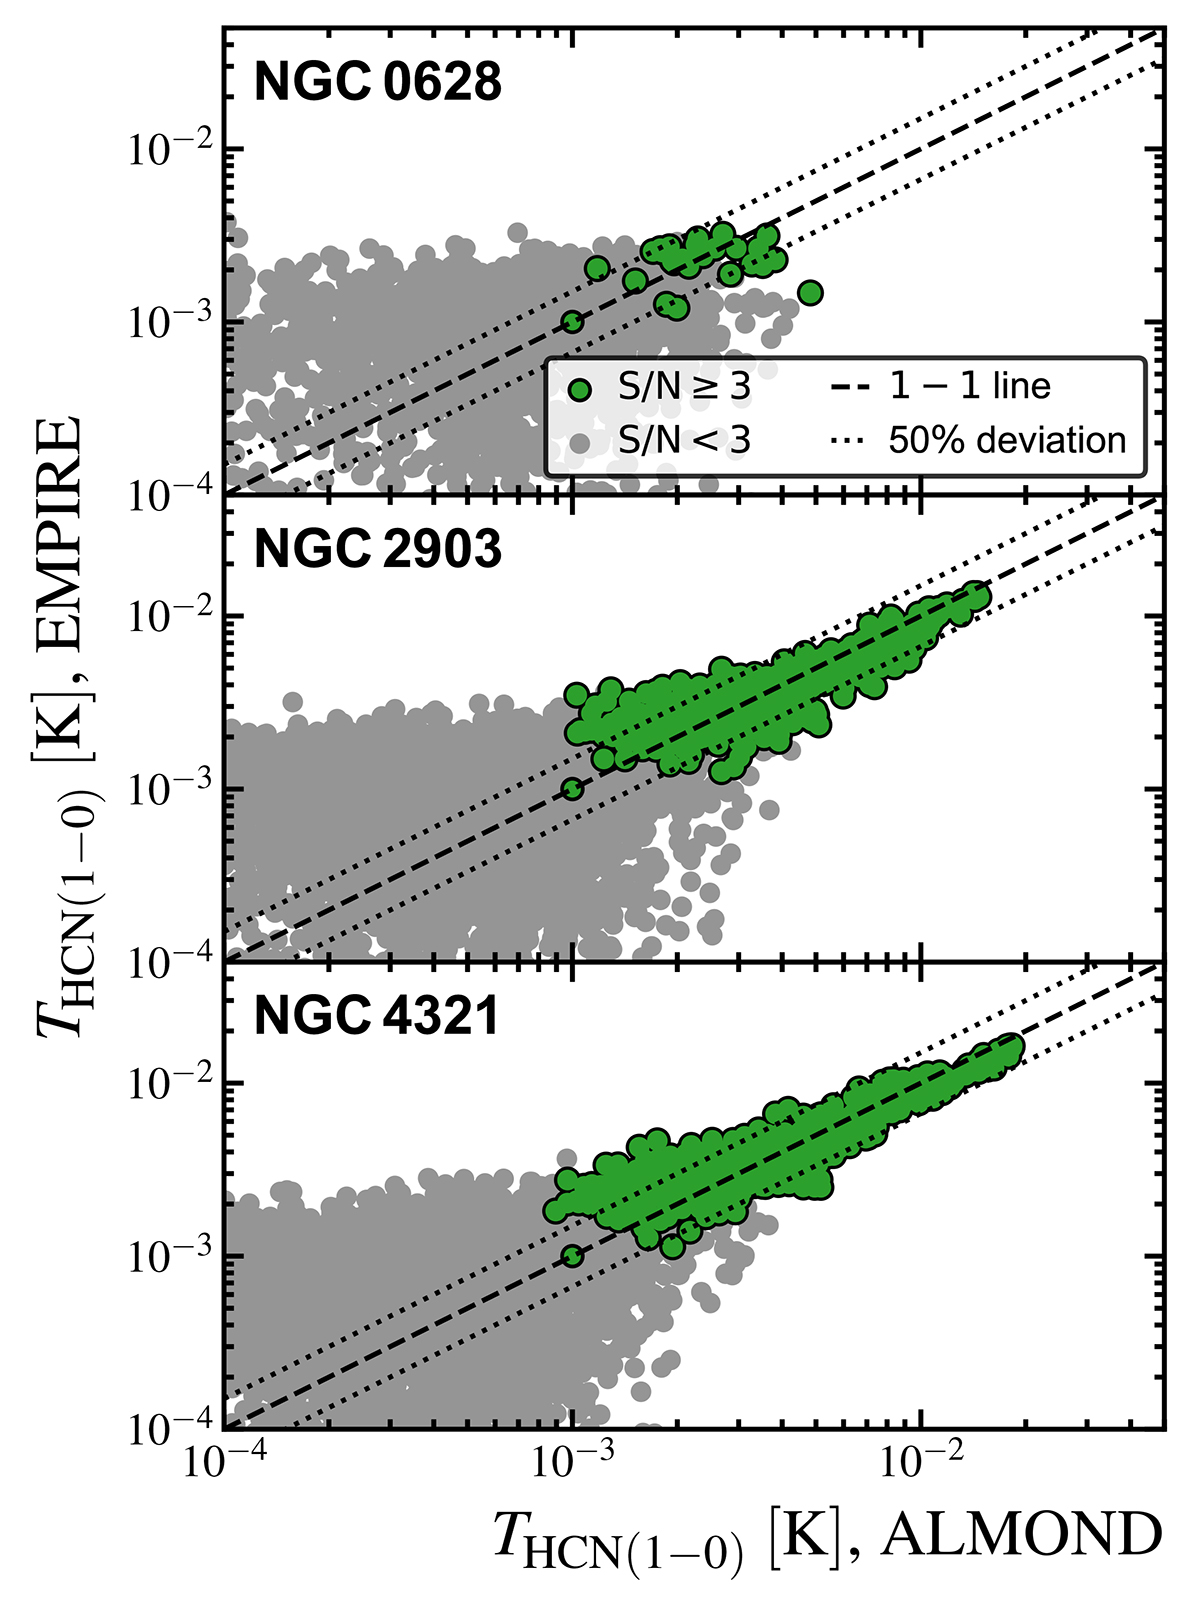
EMPIRE versus ALMOND: HCN(1 − 0) brightness temperature. Green data points present data, where EMPIRE and ALMOND both yield a 3-sigma detection. Grey data shows low-significant data points. The dashed line marks the 1-to-1 relation, where the dotted lines indicate a ±50 % deviation.
Current usage metrics show cumulative count of Article Views (full-text article views including HTML views, PDF and ePub downloads, according to the available data) and Abstracts Views on Vision4Press platform.
Data correspond to usage on the plateform after 2015. The current usage metrics is available 48-96 hours after online publication and is updated daily on week days.
Initial download of the metrics may take a while.