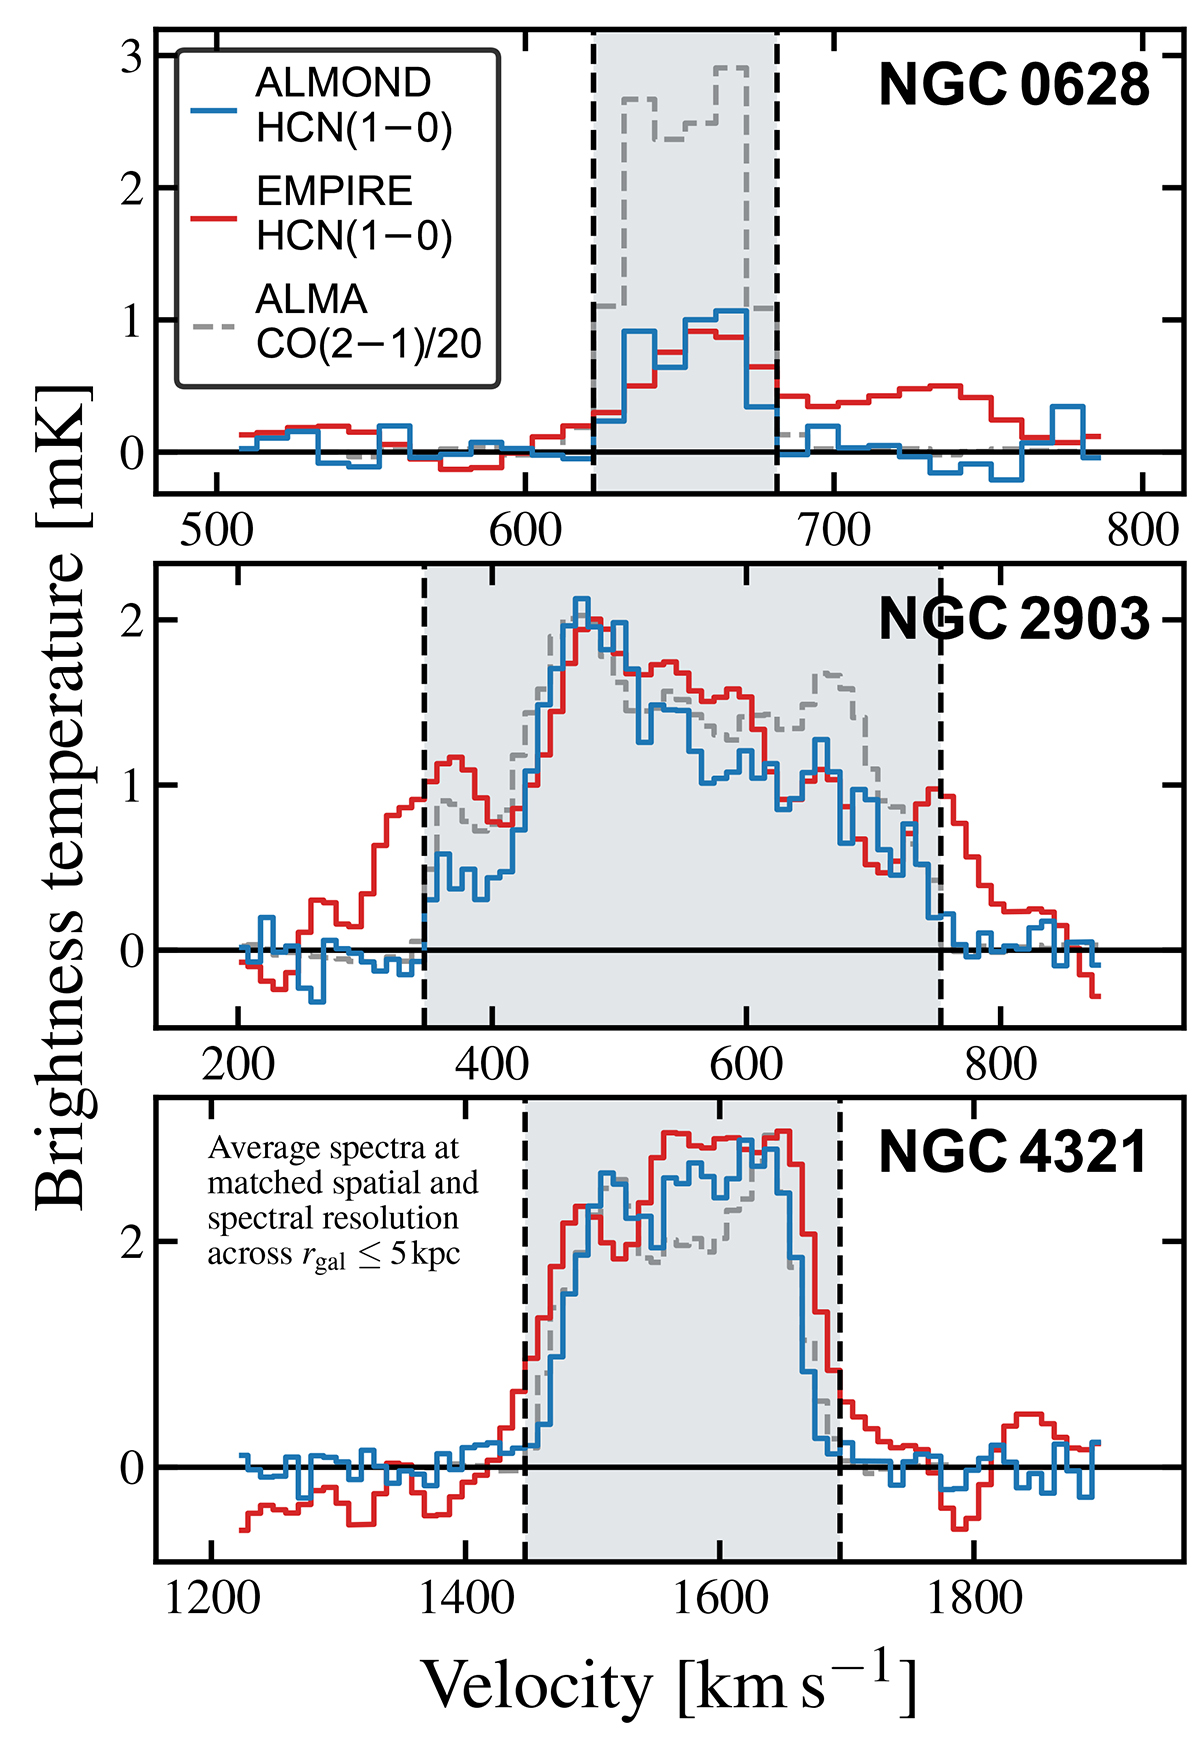
Fig. A.1.
Download original image
EMPIRE versus ALMOND: HCN(1 − 0) average spectra. The blue and red lines show average HCN brightness temperatures within rgal ≤ 5 kpc obtained from spatially and spectrally matched ALMOND and EMPIRE observations, respectively, across the three galaxies NGC 628, NGC 2903, NGC 4321 from top to bottom. The grey dashed line shows (homogenised) CO(2 − 1) intensities from PHANGS–ALMA (Leroy et al. 2021b), scaled down by a factor of 20. The grey-shaded area indicates the velocity-integration window constructed using the highly significant CO(2 − 1) data. The resulting integrated intensities are quoted in the text.
Current usage metrics show cumulative count of Article Views (full-text article views including HTML views, PDF and ePub downloads, according to the available data) and Abstracts Views on Vision4Press platform.
Data correspond to usage on the plateform after 2015. The current usage metrics is available 48-96 hours after online publication and is updated daily on week days.
Initial download of the metrics may take a while.