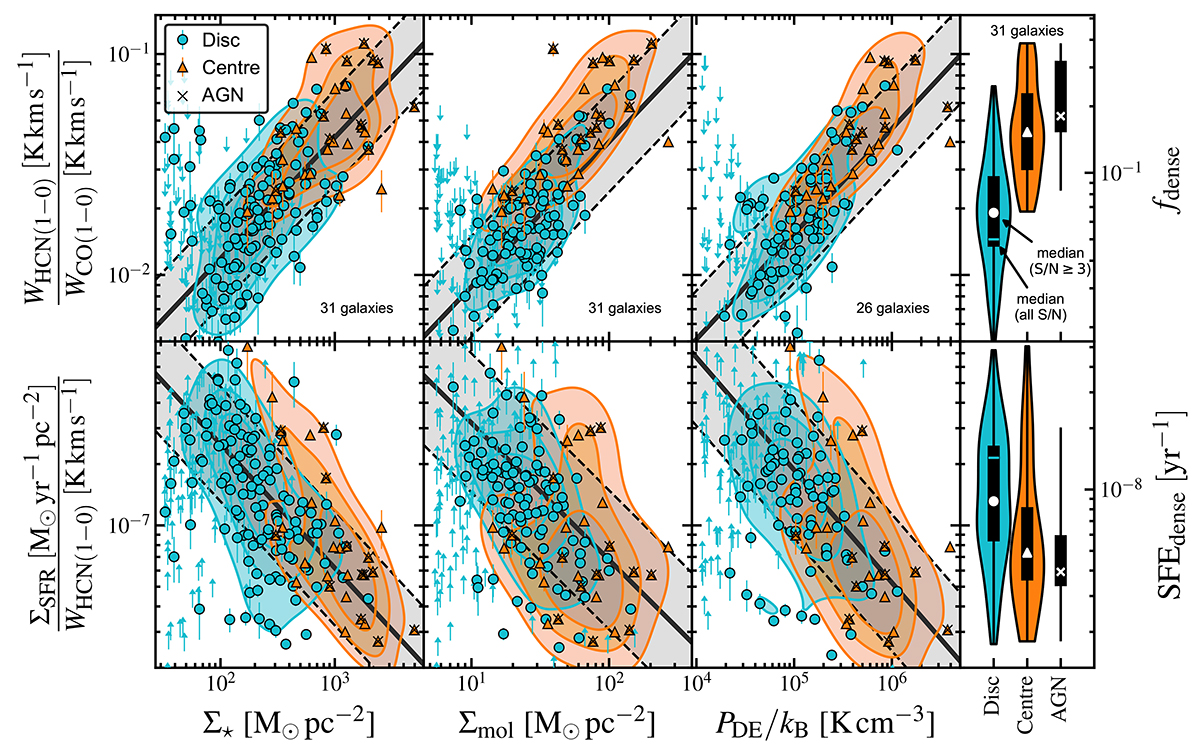
Fig. 3.
Download original image
Dense gas relations with kiloparsec-scale environmental conditions. HCN/CO (top), a proxy of fdense, and SFR/HCN (bottom), a proxy of SFEdense, are shown as a function of stellar mass surface density (Σ⋆), molecular gas surface density (Σmol), and dynamical equilibrium pressure (PDE) across 31 galaxies from ALMOND and EMPIRE. The markers denote significant stacked measurements (S/N ≥ 3) across disc (circle) and centre (triangle) spaxels. The downward and upward pointing arrows denote upper (HCN/CO) and lower limits (SFR/HCN). Filled contours show 25, 50, and 75 percentile kernel density estimates. Across centres, we indicate the presence of an AGN (cross). All relations have been fitted with LinMix, taking measurement uncertainties and upper and lower limits into account (parameters in Table 2). The solid black line shows the best-fit line, and the grey-shaded area indicates the 1-sigma scatter of S/N ≥ 3 data. The right panels show violin plots of the HCN/CO and SFR/HCN distribution across the respective samples (disc, centre, centre with an AGN), where the black bar and white markers indicate the 25th to 75th percentile range and the median, respectively, across the S/N ≥ 3 data. The vertical cyan lines in the disc violins mark the median computed from all S/N data.
Current usage metrics show cumulative count of Article Views (full-text article views including HTML views, PDF and ePub downloads, according to the available data) and Abstracts Views on Vision4Press platform.
Data correspond to usage on the plateform after 2015. The current usage metrics is available 48-96 hours after online publication and is updated daily on week days.
Initial download of the metrics may take a while.