Fig. 2.
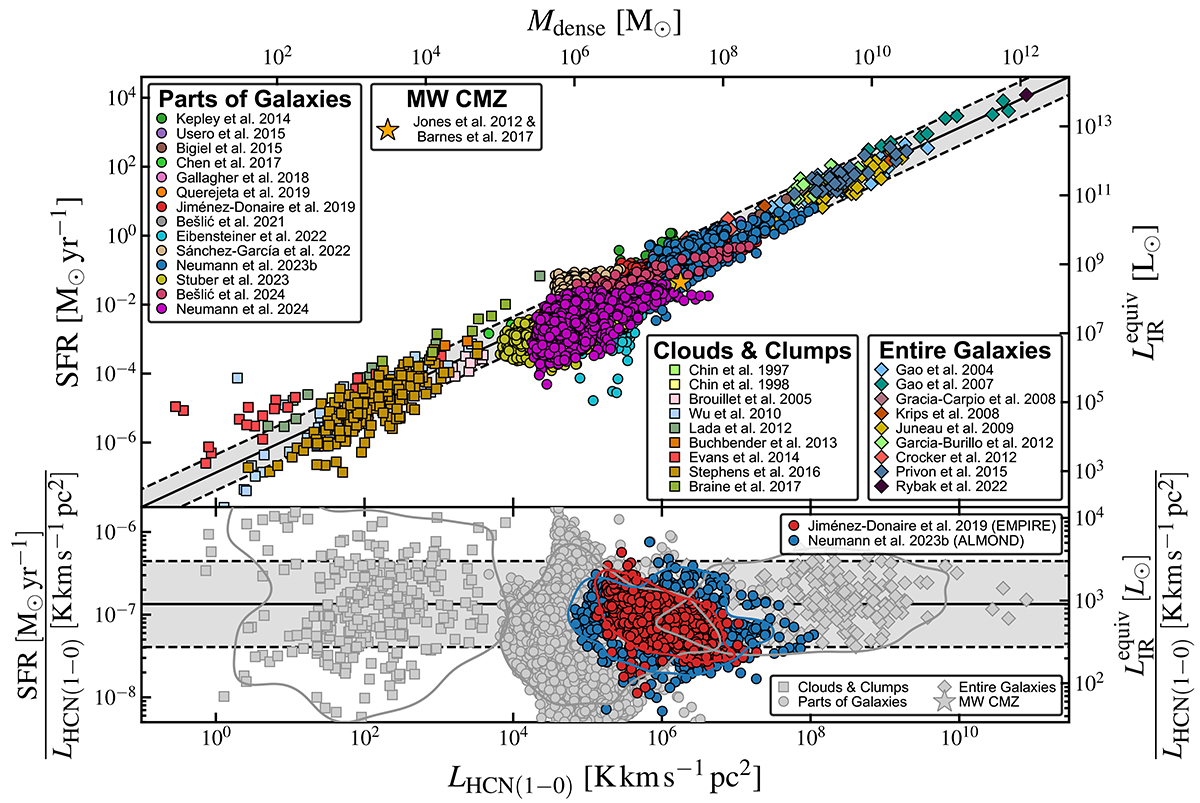
Download original image
Gao–Solomon relation. SFR (top) and SFR/LHCN (a proxy of SFEdense; bottom) as a function of HCN luminosity across a literature compilation and the ALMOND (blue circles) and EMPIRE (red circles) surveys. Note that we re-calculated the SFR across EMPIRE galaxies using a combination of IR and FUV data (see Sect. 2). Our literature compilation contains HCN observations that include Galactic clumps and clouds (squares), resolved nearby galaxies (circles), and unresolved entire galaxies (diamonds). For more details on the compilation, see Appendix B. The plotted data points show all (3-sigma) detected sightlines. The solid black line shows the median SFR/HCN computed from these data points across all datasets (without duplicates across targets), and the dashed lines mark the 1-sigma scatter (Table 1). The bottom panel shows the ratio SFR/HCN as a function of LHCN, grouping the data into the same subsamples, for which the 10-percentile density contours of the respective subsamples are shown. We plot ALMOND and EMPIRE data separately, and the blue and red contours present the 10-percentile levels of these surveys.
Current usage metrics show cumulative count of Article Views (full-text article views including HTML views, PDF and ePub downloads, according to the available data) and Abstracts Views on Vision4Press platform.
Data correspond to usage on the plateform after 2015. The current usage metrics is available 48-96 hours after online publication and is updated daily on week days.
Initial download of the metrics may take a while.