Open Access
Fig. 2.
Download original image
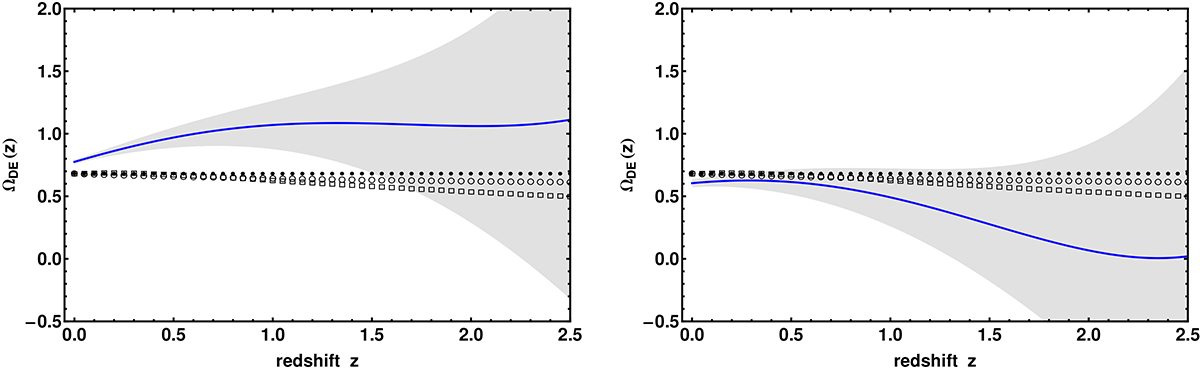
Reconstructed DE behavior with z (blue curve) with attached confidence band (gray area), compared to the expected behaviors for the ΛCDM (filled circles), the wCDM (empty circles), and the CPL (empty squares) models.
Current usage metrics show cumulative count of Article Views (full-text article views including HTML views, PDF and ePub downloads, according to the available data) and Abstracts Views on Vision4Press platform.
Data correspond to usage on the plateform after 2015. The current usage metrics is available 48-96 hours after online publication and is updated daily on week days.
Initial download of the metrics may take a while.