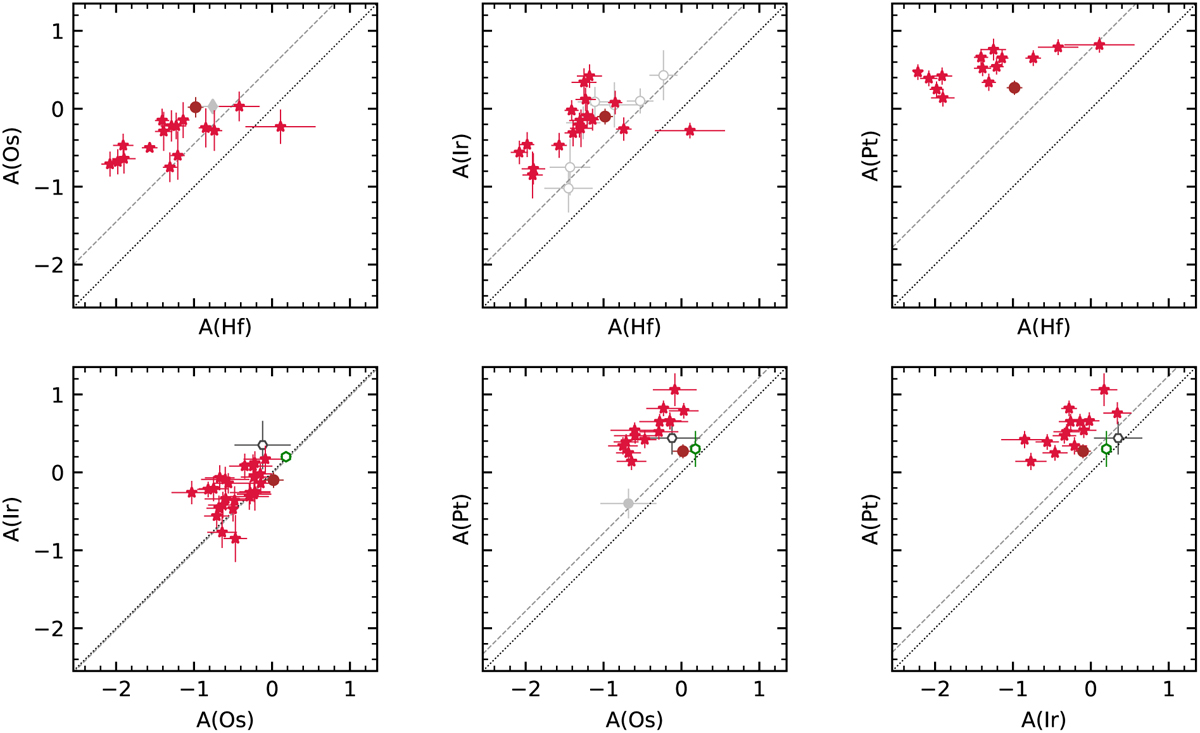
Fig. 7
Download original image
A(X) for each of the four species under study. Markers are the same as in Fig. 6. Dotted lines represent the identity function. Dashed lines represent solar-scaled values; i.e., their y-intercept gives the A(y-axis)/A(x-axis) solar values. Upper limits are omitted in this figure. The x-axis values are the same in all three panels.
Current usage metrics show cumulative count of Article Views (full-text article views including HTML views, PDF and ePub downloads, according to the available data) and Abstracts Views on Vision4Press platform.
Data correspond to usage on the plateform after 2015. The current usage metrics is available 48-96 hours after online publication and is updated daily on week days.
Initial download of the metrics may take a while.