Open Access
Fig. 5
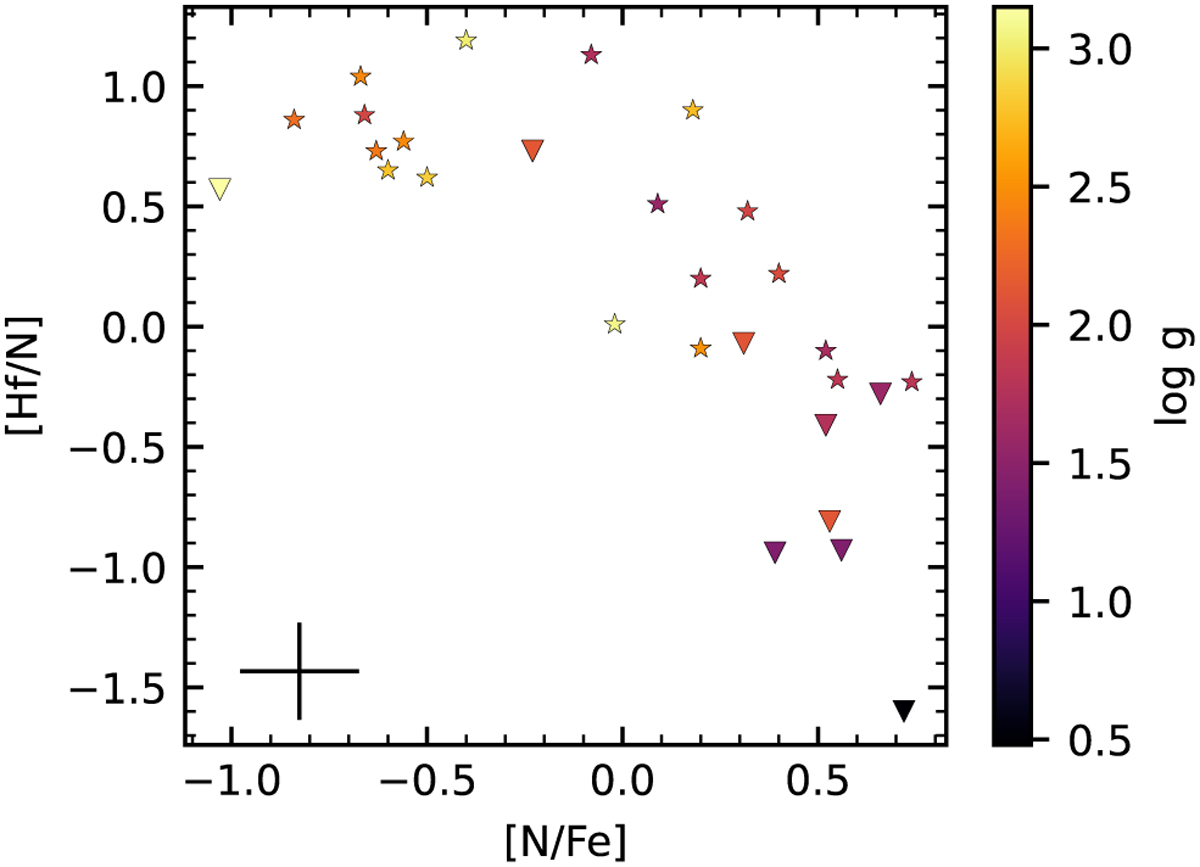
Download original image
Ratio between Hf and N as a function of the N abundances from Paper II, coloured according to surface gravity. Triangles are upper limits. The error bars in the lower left corner represent the median uncertainties.
Current usage metrics show cumulative count of Article Views (full-text article views including HTML views, PDF and ePub downloads, according to the available data) and Abstracts Views on Vision4Press platform.
Data correspond to usage on the plateform after 2015. The current usage metrics is available 48-96 hours after online publication and is updated daily on week days.
Initial download of the metrics may take a while.